For the relationship represented in this table, $y$ is proportional to $x$. We can see in the table that $\frac54$ is the constant of proportionality because it’s the $y$ value when $x$ is 1.
The equation $y = \frac54 x$ also represents this relationship.
| |
$x$ |
$y$ |
| row 1 |
4 |
5 |
| row 2 |
5 |
$\frac{25}{4}$ |
| row 3 |
8 |
10 |
| row 4 |
1 |
$\frac{5}{4}$ |
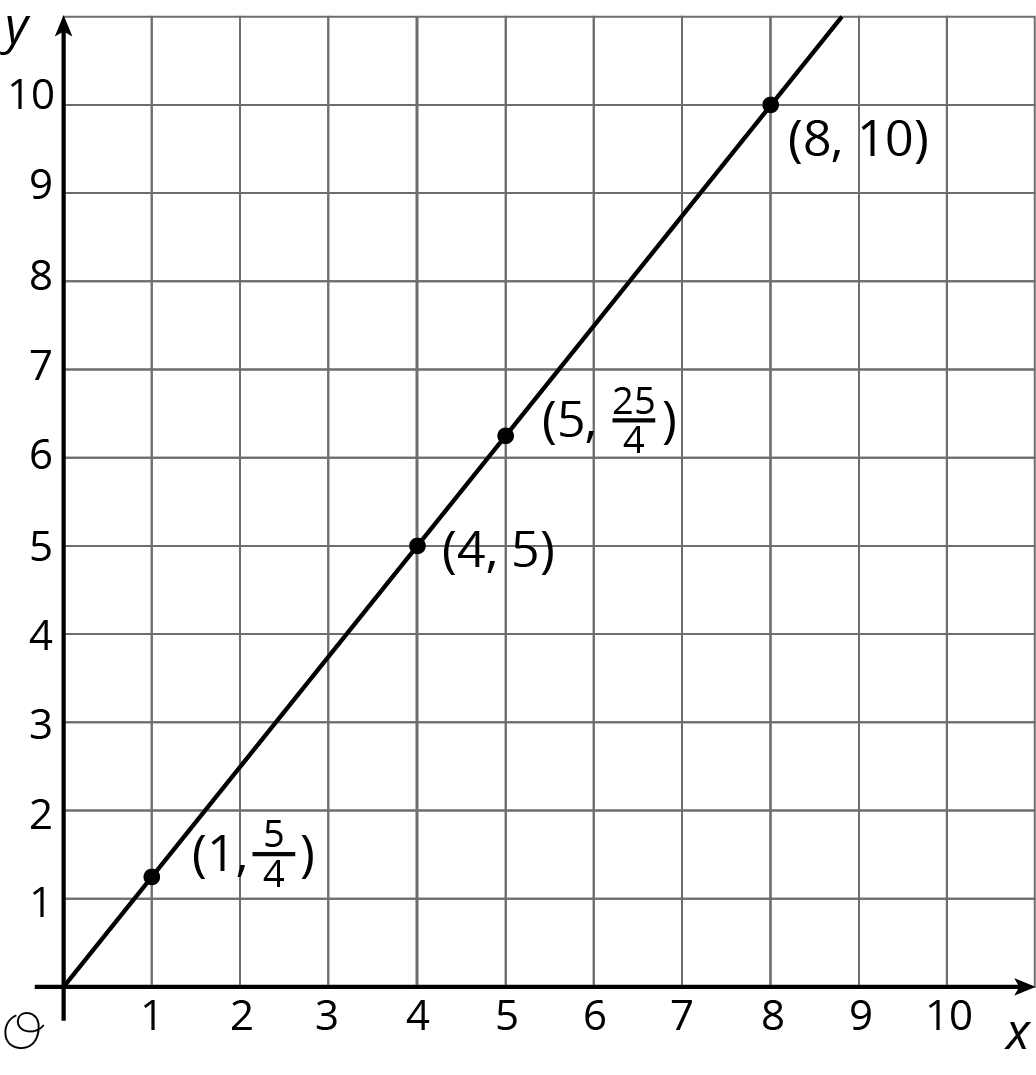
Here is the graph of this relationship.
If $y$ represents the distance in feet that a snail crawls in $x$ minutes, then the point $(4, 5)$ tells us that the snail can crawl 5 feet in 4 minutes.
If $y$ represents the cups of yogurt and $x$ represents the teaspoons of cinnamon in a recipe for fruit dip, then the point $(4, 5)$ tells us that you can mix 4 teaspoons of cinnamon with 5 cups of yogurt to make this fruit dip.
We can find the constant of proportionality by looking at the graph, because $\frac54$ is the $y$-coordinate of the point on the graph where the $x$-coordinate is 1. This could mean the snail is traveling $\frac54$ feet per minute or that the recipe calls for $1\frac14$ cups of yogurt for every teaspoon of cinnamon.
In general, when $y$ is proportional to $x$, the corresponding constant of proportionality is the $y$-value when $x=1$.


