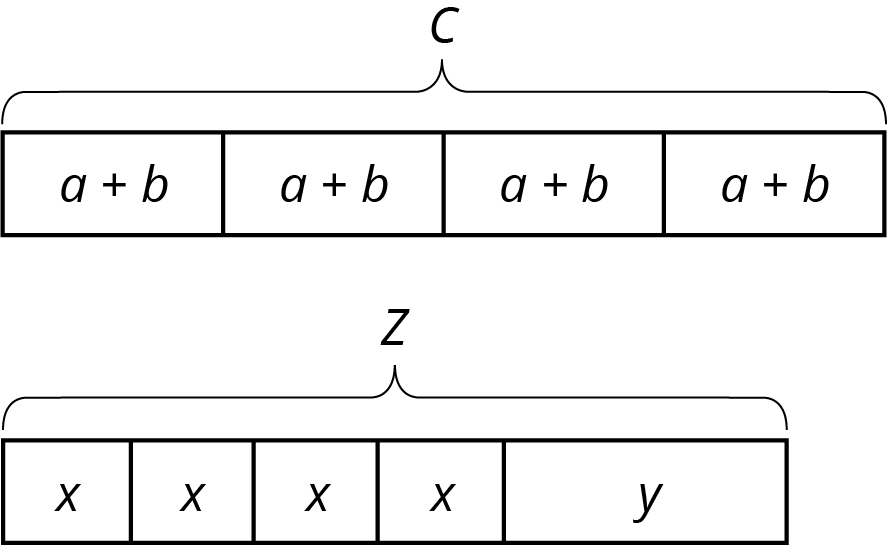
2.1: Remembering Tape Diagrams

- What do you notice? What do you wonder?
- What are some possible values for $a$, $b$, and $c$ in the first diagram?
For $x$, $y$, and $z$ in the second diagram? How did you decide on those values?
Let’s use tape diagrams to make sense of different kinds of stories.

Here are three stories with a diagram that represents it. With your group, decide who will go first. That person explains why the diagram represents the story. Work together to find any unknown amounts in the story. Then, switch roles for the second diagram and switch again for the third.


Mai distributed another group of flyers equally among the five volunteers. Then she remembered that she needed some flyers to give to teachers, so she took 2 flyers from each volunteer. Then, the volunteers had a total of 40 flyers to hang up.

Here are three more stories. Draw a tape diagram to represent each story. Then describe how you would find any unknown amounts in the stories.
Design a tiling that uses a repeating pattern consisting of 2 kinds of shapes (e.g., 1 hexagon with 3 triangles forming a triangle). How many times did you repeat the pattern in your picture? How many individual shapes did you use?
Tape diagrams are useful for representing how quantities are related and can help us answer questions about a situation.
Suppose a school receives 46 copies of a popular book. The library takes 26 copies and the remainder are split evenly among 4 teachers. How many books does each teacher receive? This situation involves 4 equal parts and one other part. We can represent the situation with a rectangle labeled 26 (books given to the library) along with 4 equal-sized parts (books split among 4 teachers). We label the total, 46, to show how many the rectangle represents in all. We use a letter to show the unknown amount, which represents the number of books each teacher receives. Using the same letter, $x$, means that the same number is represented four times.

Some situations have parts that are all equal, but each part has been increased from an original amount:
A company manufactures a special type of sensor, and packs them in boxes of 4 for shipment. Then a new design increases the weight of each sensor by 9 grams. The new package of 4 sensors weighs 76 grams. How much did each sensor weigh originally?
We can describe this situation with a rectangle representing a total of 76 split into 4 equal parts. Each part shows that the new weight, $x+9$, is 9 more than the original weight, $x$.
