Unit 2: Practice Problem Sets

Lesson 1

Problem 1

Which one of these shapes is not like the others? Explain what makes it different by representing each width and height pair with a ratio.
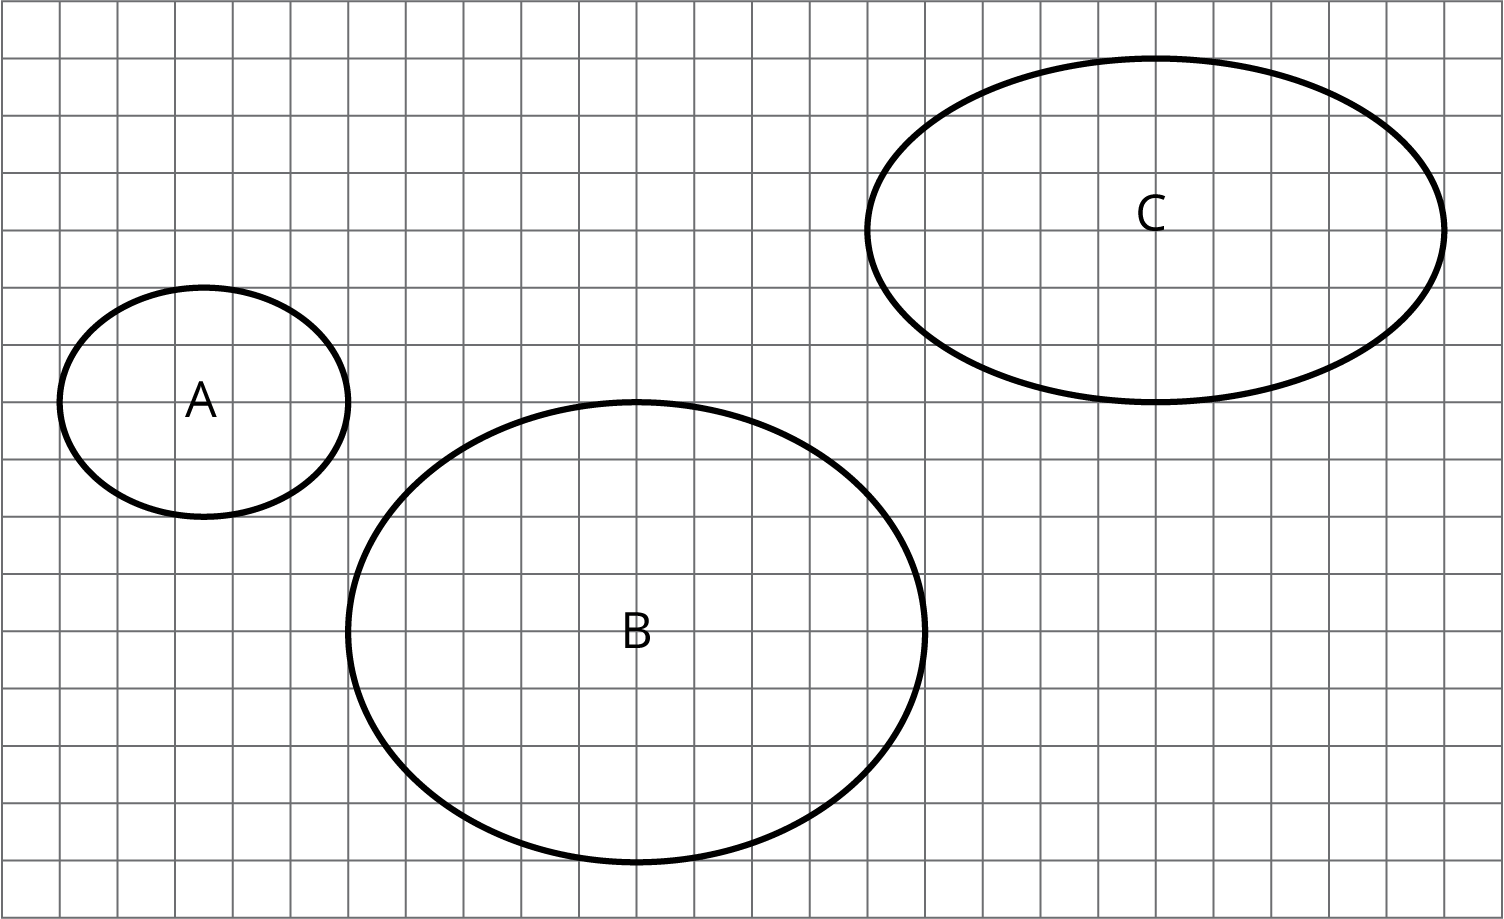
Rectangular grid with 3 circular shapes labeled A, B, and C. Shape A has width 5 units and height 4 units. Shape B has width 10 units and height 8 units. Shape C has width 10 units and height 6 units.

Problem 2

In one version of a trail mix, there are 3 cups of peanuts mixed with 2 cups of raisins. In another version of trail mix, there are 4.5 cups of peanuts mixed with 3 cups of raisins. Are the ratios equivalent for the two mixes? Explain your reasoning.

Problem 3 (from Unit 1, Lesson 12)

For each object, choose an appropriate scale for a drawing that fits on a regular sheet of paper. Not all of the scales on the list will be used.

Objects

  1. A person
  2. A football field (120 yards by 53$\frac{1}{3}$ yards)
  3. The state of Washington (about 240 miles by 360 miles)
  4. The floor plan of a house
  5. A rectangular farm (6 miles by 2 mile)

Scales

  1. 1 in : 1 ft
  2. 1 cm : 1 m
  3. 1: 1000
  4. 1 ft: 1 mile
  5. 1: 100,000
  6. 1 mm: 1 km
  7. 1: 10,000,000

Problem 4 (from Unit 1, Lesson 11)

Which scale is equivalent to 1 cm to 1 km?

  1. 1 to 1000
  2. 10,000 to 1
  3. 1 to 100,000
  4. 100,000 to 1
  5. 1 to 1,000,000

Problem 5 (from Unit 2, Lesson 5)

  1. Find 3 different ratios that are equivalent to $7:3$.
  2. Explain why these ratios are equivalent.

Lesson 2

Problem 1

When Han makes chocolate milk, he mixes 2 cups of milk with 3 tablespoons of chocolate syrup. Here is a table that shows how to make batches of different sizes.
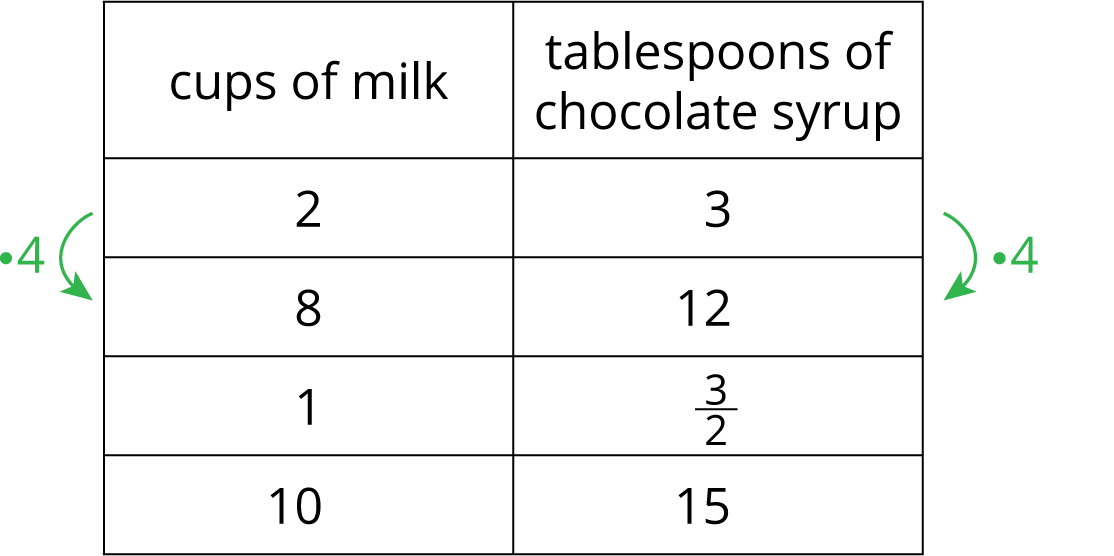
A 2-column table with 4 rows of data. The first column is labeled "cups of milk" and the second column is labeled "tablespoons of chocolate syrup." Row 1: 2, 3; Row 2: 8, 12; Row 3: 1, 3/2; Row 4: 10, 15. There is an arrow pointing from row 1 to row 2 labeled "times 4."

Use the information in the table to complete the statements. Some terms are used more than once.

  1. The table shows a proportional relationship between ______________ and ______________.
  2. The scale factor shown is ______________.
  3. The constant of proportionality for this relationship is ______________.
  4. The units for the constant of proportionality are ______________ per ______________.

Bank of Terms: tablespoons of chocolate syrup, $4$, cups of milk, cup of milk, $\frac32$

Problem 2

A certain shade of pink is created by adding 3 cups of red paint to 7 cups of white paint.

  1. How many cups of red paint should be added to 1 cup of white paint?
      cups of white paint cups of red paint
    Row 1 1  
    Row 2 7 3
  2. What is the constant of proportionality?

Problem 3 (from Unit 1, Lesson 12)

A map of a rectangular park has a length of 4 inches and a width of 6 inches. It uses a scale of 1 inch for every 30 miles.

  1. What is the actual area of the park? Show how you know.

  2. The map needs to be reproduced at a different scale so that it has an area of 6 square inches and can fit in a brochure. At what scale should the map be reproduced so that it fits on the brochure? Show your reasoning.

Problem 4 (from Unit 1, Lesson 6)

Noah drew a scaled copy of Polygon P and labeled it Polygon Q.
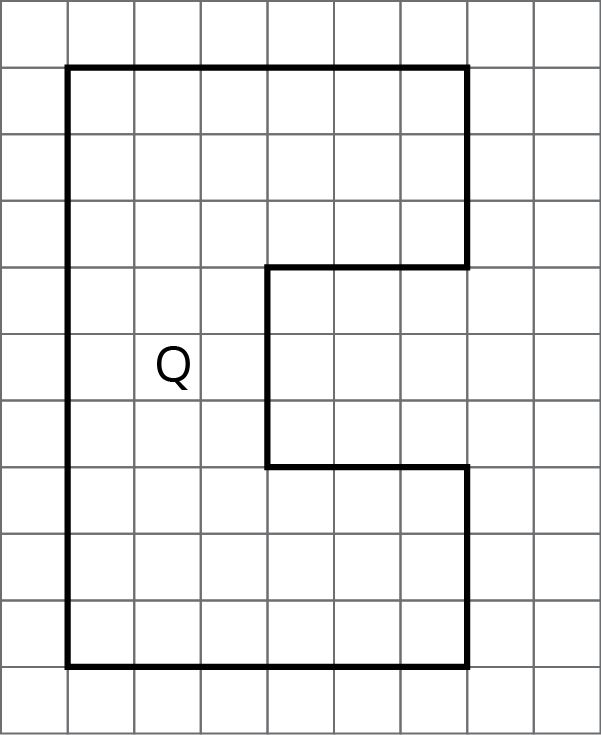
Polygon Q on a grid. Polygon Q has 8 sides. Starting at the bottom left corner, the first side is 9 units up, the second side is 6 units right, the third side is 3 units down, the fourth side is3 units left, the fifth side is 3 units down, the sixth side is 3 units right, the seventh side is 3 units down, and the eighth side is 6 units left.

If the area of Polygon P is 5 square units, what scale factor did Noah apply to Polygon P to create Polygon Q? Explain or show how you know.

Problem 5 (from Unit 2, Lesson 5)

Select all the ratios that are equivalent to each other.

  1. $4:7$
  2. $8:15$
  3. $16:28$
  4. $2:3$
  5. $20:35$

Lesson 3

Problem 1

Noah is running a portion of a marathon at a constant speed of 6 miles per hour.

Complete the table to predict how long it would take him to run different distances at that speed, and how far he would run in different time intervals.

row 1 time
in hours
miles traveled at
6 miles per hour
row 2 1  
row 3 $\frac12$  
row 4 $1\frac13$  
row 5   $1\frac12$
row 6   9
row 7   $4\frac12$

Problem 2

One kilometer is 1000 meters.  

  1. Complete the tables. What is the interpretation of the constant of proportionality in each case?
    row 1 meters kilometers
    row 2 1,000 1
    row 3 250  
    row 4 12  
    row 5 1  
    row 1 kilometers meters
    row 2 1 1,000
    row 3 5  
    row 4 20  
    row 5 0.3  

    The constant of proportionality tells us that:

    The constant of proportionality tells us that:

  2. What is the relationship between the two constants of proportionality?

Problem 3

Jada and Lin are comparing inches and feet. Jada says that the constant of proportionality is 12. Lin says it is $\frac{1}{12}$. Do you agree with either of them? Explain your reasoning.

Problem 4 (from Unit 1, Lesson 12)

The area of the Mojave desert is 25,000 square miles. A scale drawing of the Mojave desert has an area of 10 square inches. What is the scale of the map?

Problem 5 (from Unit 1, Lesson 11)

Which of these scales is equivalent to the scale 1 cm to 5 km? Select all that apply.

  1. 3 cm to 15 km

  2. 1 mm to 150 km

  3. 5 cm to 1 km

  4. 5 mm to 2.5 km

  5. 1 mm to 500 m

Problem 6 (from Unit 2, Lesson 1)

Which one of these pictures is not like the others? Explain what makes it different using ratios.
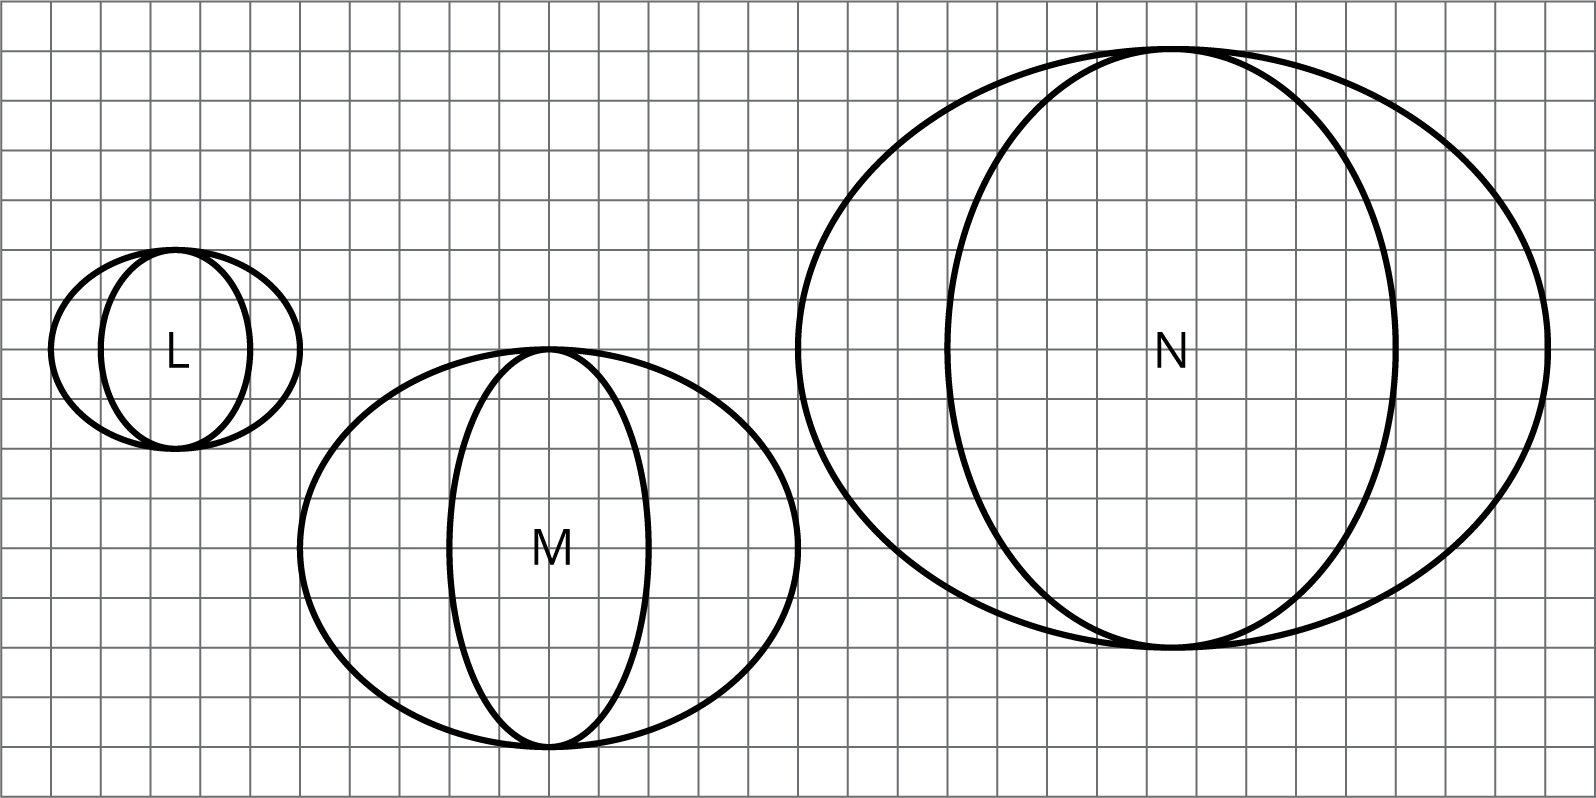
Three ovals labeled L, M and N on a coordinate grid. Each oval has a smaller oval inside.   At its widest point, each oval has the following dimesions: Oval L, outside oval width 5 units, outside oval thickness 1 unit, inside oval width 3 units, height 4 units. Oval M, outside oval width 10 units, outside oval thickness, 3, inside oval width 4 units, height 8 units. Oval N, outside oval width 15 units, outside oval thickness 3, inside oval width 9 units, height 12 units.

Lesson 4

Problem 1

A certain ceiling is made up of tiles. Every square meter of ceiling requires 10.75 tiles. Fill in the table with the missing values.

  square meters of ceiling number of tiles
row 1 1  
row 2 10  
row 3   100
row 4 $a$  

Problem 2

On a flight from New York to London, an airplane travels at a constant speed. An equation relating the distance traveled in miles, $d$, to the number of hours flying, $t$, is $t = \frac{1}{500} d$. How long will it take the airplane to travel 800 miles?

Problem 3

Each table represents a proportional relationship. For each, find the constant of proportionality, and write an equation that represents the relationship.

  $s$ $P$
row 1 2 8
row 2 3 12
row 3 5 20
row 4 10 40

Constant of proportionality:

Equation: $P =$

  $d$ $C$
row 1 2 6.28
row 2 3 9.42
row 3 5 15.7
row 4 10 31.4

Constant of proportionality:

Equation: $C =$


Problem 4 (from Unit 1, Lesson 11)

A map of Colorado says that the scale is 1 inch to 20 miles or 1 to 1,267,200. Are these two ways of reporting the scale the same? Explain your reasoning.

Problem 5 (from Unit 1, Lesson 3)

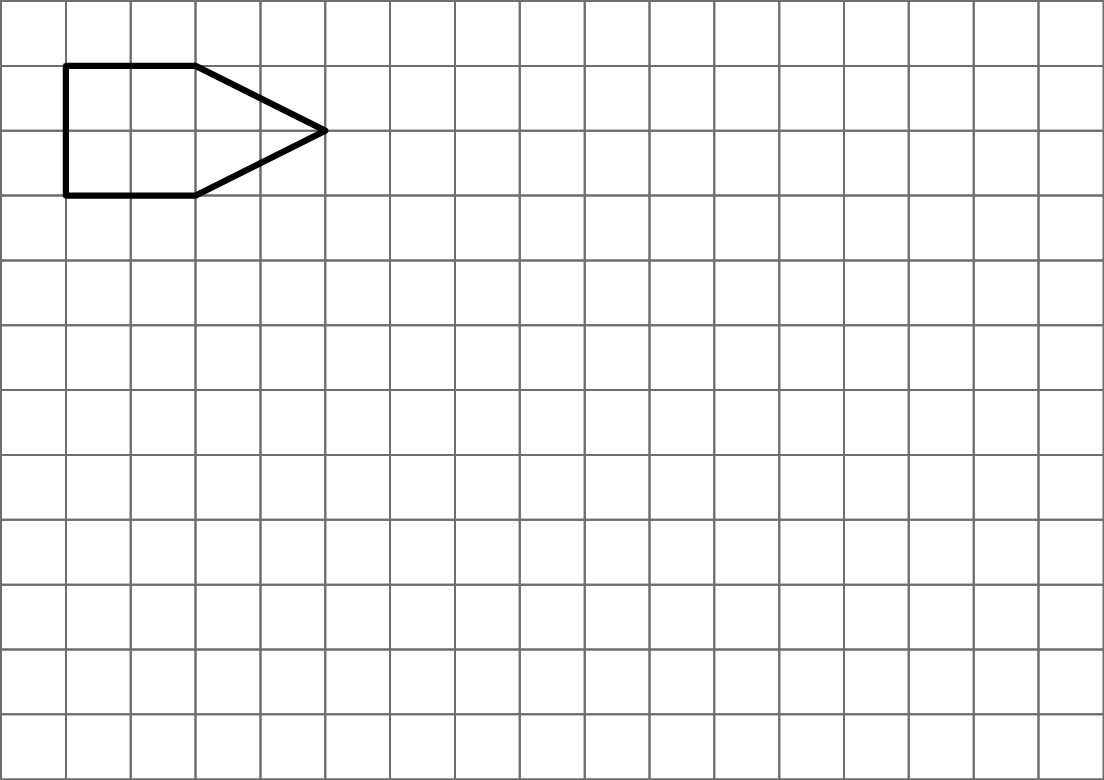
Here is a polygon on a grid.

A polygon aligned to a square grid. The polygon is made up of two shapes, joined together on an edge. To the left is a square that has side lengths of 2 units. On the right of the square, is an isosceles triangle with its 2 unit length base joined to the edge of the square. The vertex of the triangle is 2 units to the right.
  1. Draw a scaled copy of the polygon using a scale factor 3. Label the copy A.

  2. Draw a scaled copy of the polygon with a scale factor $\frac{1}{2}$. Label it B.

  3. Is Polygon A a scaled copy of Polygon B? If so, what is the scale factor that takes B to A?

Lesson 5

Problem 1

The table represents the relationship between a length measured in meters and the same length measured in kilometers. 

  1. Complete the table.
  2. Write an equation for converting the number of meters to kilometers. Use $x$ for number of meters and $y$ for number of kilometers.
  meters kilometers
row 1 1,000 1
row 2 3,500  
row 3 500  
row 4 75  
row 5 1  
row 6 $x$  

Problem 2

Concrete building blocks weigh 28 pounds each. Using $b$ for the number of concrete blocks and $w$ for the weight, write two equations that relate the two variables. One equation should begin with $w = $ and the other should begin with $b =$.

Problem 3

A store sells rope by the meter. The equation $p = 0.8L$ represents the price $p$ (in dollars) of a piece of nylon rope that is $L$ meters long.

  1. How much does the nylon rope cost per meter?
  2. How long is a piece of nylon rope that costs $1.00?

Problem 4 (from Unit 2, Lesson 4)

The table represents a proportional relationship. Find the constant of proportionality and write an equation to represent the relationship.

  $a$ $y$
row 1 2 $\frac23$
row 2 3 1
row 3 10 $\frac{10}{3}$
row 4 12 4

Constant of proportionality: __________

Equation: $y =$

Problem 5 (from Unit 1, Lesson 8)

On a map of Chicago, 1 cm represents 100 m. Select all statements that express the same scale.

  1. 5 cm on the map represents 50 m in Chicago.

  2. 1 mm on the map represents 10 m in Chicago.

  3. 1 km in Chicago is represented by 10 cm the map.

  4. 100 cm in Chicago is represented by 1 m on the map.

Lesson 6

Problem 1

A car is traveling down a highway at a constant speed, described by the equation $d = 65t$, where $d$ represents the distance, in miles, that the car travels at this speed in $t$ hours.

  1. What does the 65 tell us in this situation?
  2. How many miles does the car travel in 1.5 hours?
  3. How long does it take the car to travel 26 miles at this speed?

Problem 2

Elena has some bottles of water that each holds 17 fluid ounces.

  1. Write an equation that relates the number of bottles of water ($b$) to the total volume of water ($w$) in fluid ounces.
  2. How much water is in 51 bottles?
  3. How many bottles does it take to hold 51 fluid ounces of water?

Problem 3 (from Unit 2, Lesson 5)

There are about 1.61 kilometers in 1 mile. Let $x$ represent a distance measured in kilometers and $y$ represent the same distance measured in miles. Write two equations that relate a distance measured in kilometers and the same distance measured in miles.

Problem 4 (from Unit 2, Lesson 2)

In Canadian coins, 16 quarters is equal in value to 2 toonies.

  number of quarters number of toonies
row 1 1  
row 2 16 2
row 3 20  
row 4 24  
  1. Fill in the table.
  2. What does the value next to 1 mean in this situation?

Problem 5 (from Unit 2, Lesson 2)

Each table represents a proportional relationship. For each table:

  1. Fill in the missing parts of the table.
  2. Draw a circle around the constant of proportionality.
row 1 $x$ $y$
row 2 2 10
row 3   15
row 4 7  
row 5 1  
row 1 $a$ $b$
row 2 12 3
row 3 20  
row 4   10
row 5 1  
row 1 $m$ $n$
row 2 5 3
row 3 10  
row 4   18
row 5 1  

Problem 6 (from Unit 1, Lesson 4)

Describe some things you could notice in two polygons that would help you decide that they were not scaled copies.

Lesson 7

Problem 1

Decide whether each table could represent a proportional relationship. If the relationship could be proportional, what would the constant of proportionality be?

  1. How loud a sound is depending on how far away you are
    row 1 distance to
    listener (ft)
    sound
    level (dB)
    row 2 5 85
    row 3 10 79
    row 4 20 73
    row 5 40 67
  1. The cost of fountain drinks at Hot Dog Hut.
    row 1 volume
    (fluid ounces)
    cost
    ($)
    row 2 16 \$1.49
    row 3 20 \$1.59
    row 4 30 \$1.89

Problem 2

A taxi service charges \$1.00 for the first $\frac{1}{10}$ mile then \$0.10 for each additional $\frac{1}{10}$ mile after that.

Fill in the table with the missing information then determine if this relationship between distance traveled and price of the trip is a proportional relationship.

  distance traveled (mi) price (dollars)
row 1 $\frac{9}{10}$  
row 2 2  
row 3 $3\frac{1}{10}$  
row 4 10  
 

Problem 3

A rabbit and turtle are in a race. Is the relationship between distance traveled and time proportional for either one? If so, write an equation that represents the relationship.

Turtle’s run:

  distance (meters) time (minutes)
row 1 108 2
row 2 405 7.5
row 3 540 10
row 4 1,768.5 32.75

Rabbit’s run:

  distance (meters) time (minutes)
row 1 800 1
row 2 900 5
row 3 1,107.5 20
row 4 1,524 32.5

Problem 4 (from Unit 2, Lesson 2)

For each table, answer: What is the constant of proportionality?

  1. row 1 a b
    row 2 2 14
    row 3 5 35
    row 4 9 63
    row 5 $\frac13$ $\frac73$
  1. row 1 a b
    row 2 3 360
    row 3 5 600
    row 4 8 960
    row 5 12 1440
  1. row 1 a b
    row 2 75 3
    row 3 200 8
    row 4 1525 61
    row 5 10 0.4
  1. row 1 a b
    row 2 4 10
    row 3 6 15
    row 4 22 55
    row 5 3 $7\frac12$

Problem 5 (from Unit 1, Lesson 4)

Kiran and Mai are standing at one corner of a rectangular field of grass looking at the diagonally opposite corner. Kiran says that if the the field were twice as long and twice as wide, then it would be twice the distance to the far corner. Mai says that it would be more than twice as far, since the diagonal is even longer than the side lengths. Do you agree with either of them?

Lesson 8

Problem 1

The relationship between a distance in yards ($y$) and the same distance in miles ($m$) is described by the equation $y = 1760m$.

  1. Find measurements in yards and miles for distances by filling in the table.
    row 1 distance measured in miles distance measured in yards
    row 2 1  
    row 3 5  
    row 4   3,520
    row 5   17,600
  2. Is there a proportional relationship between a measurement in yards and a measurement in miles for the same distance? Explain why or why not.

Problem 2

Decide whether or not each equation represents a proportional relationship.

  1. The remaining length ($L$) of 120-inch rope after $x$ inches have been cut off: $120-x = L$
  2. The total cost ($t$) after 8% sales tax is added to an item's price ($p$): $1.08p = t$
  3. The number of marbles each sister gets ($x$) when $m$ marbles are shared equally among four sisters: $x = \frac{m}{4}$
  4. The volume ($V$) of a rectangular prism whose height is 12 cm and base is a square with side lengths $s$ cm: $V = 12s^2$

Problem 3

  1. Use the equation $y = \frac52 x$ to fill in the table.

    Is $y$ proportional to $x$ and $y$? Explain why or why not.

      $x$ $y$
    row 1 2  
    row 2 3  
    row 3 6  
  2. Use the equation $y = 3.2x+5$ to fill in the table.

    Is $y$ proportional to $x$ and $y$? Explain why or why not.

      $x$ $y$
    row 1 1  
    row 2 2  
    row 3 4  

Problem 4 (from Unit 2, Lesson 6)

To transmit information on the internet, large files are broken into packets of smaller sizes. Each packet has 1,500 bytes of information. An equation relating packets to bytes of information is given by $b = 1,\!500p$ where $p$ represents the number of packets and $b$ represents the number of bytes of information.

  1. How many packets would be needed to transmit 30,000 bytes of information?
  2. How much information could be transmitted in 30,000 packets?
  3. Each byte contains 8 bits of information. Write an equation to represent the relationship between the number of packets and the number of bits.

Lesson 9

Problem 1

For each situation, explain whether you think the relationship is proportional or not. Explain your reasoning.

  1. The weight of a stack of standard 8.5x11 copier paper vs. number of sheets of paper.
  2. The weight of a stack of different-sized books vs. the number of books in the stack.

An image of a stack of copier paper.

An image of 5 different-sized books, stacked on top of one another.

Problem 2

Every package of a certain toy also includes 2 batteries.

  1. Are the number of toys and number of batteries in a proportional relationship? If so, what are the two constants of proportionality? If not, explain your reasoning.
  2. Use $t$ for the number of toys and $b$ for the number of batteries to write two equations relating the two variables.

    $b = $

    $t = $

Problem 3

Lin and her brother were born on the same date in different years. Lin was 5 years old when her brother was 2.

  1. Find their ages in different years by filling in the table.
    row 1 Lin's age Her brother's age
    row 2 5 2
    row 3 6  
    row 4 15  
    row 5   25
  2. Is there a proportional relationship between Lin’s age and her brother’s age? Explain your reasoning.

Problem 4 (from Unit 2, Lesson 8)

A student argues that $y=\frac{x}{9}$ does not represent a proportional relationship between $x$ and $y$ because we need to multiply one variable by the same constant to get the other one and not divide it by a constant. Do you agree or disagree with this student?

Problem 5 (from Unit 1, Lesson 3)

Quadrilateral A has side lengths 3, 4, 5, and 6. Quadrilateral B is a scaled copy of Quadrilateral A with a scale factor of 2. Select all of the following that are side lengths of Quadrilateral B.

  1. 5
  2. 6
  3. 7
  4. 8
  5. 9

Lesson 10

Problem 1


Which graphs could represent a proportional relationship? Explain how you decided.
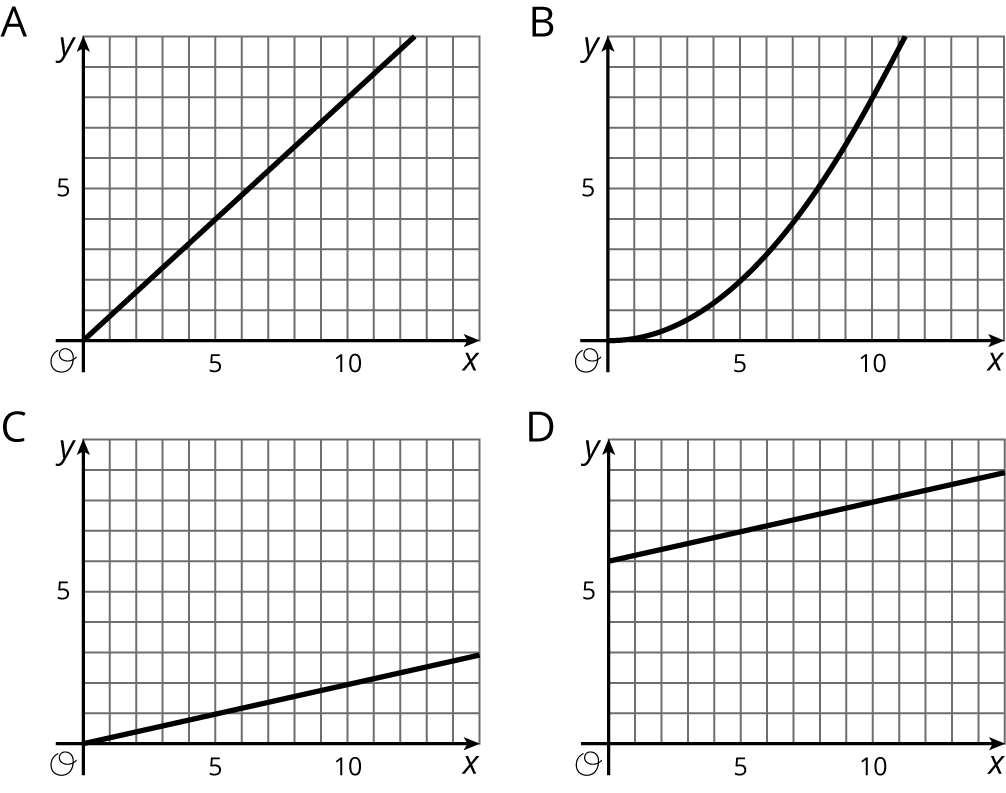
Four graphs of curves labeled A, B, C, and D in the xy coordinate plane with the origin labeled “O”. For each graph, the x axis has the numbers 0, 5, and 10 indicated. The y axis has the numbers 0 and 5.  In graph A, the curve is a line that begins at the origin and moves steadily upward and to the right.  In graph B, the curve begins at the origin and moves upward and to the right. It moves slowly in the beginning and then goes steeply upward. In graph C, the curve is a line that begins at the origin and moves slowly upward and to the right.  In graph D, the curve is a line that begins on the vertical axis and above the origin. It moves slowly upward and to the right.

Problem 2

A lemonade recipe calls for $\frac14$ cup of lemon juice for every cup of water.

  1. Use the table to answer these questions.
    1. What does $x$ represent?
    2. What does $y$ represent?
    3. Is there a proportional relationship between $x$ and $y$?
  2. Plot the pairs in the table in a coordinate plane. 
  $x$ $y$
row 1 1 $\frac14$
row 2 2 $\frac12$
row 3 3 $\frac34$
row 4 4 1
row 5 5 $1\frac14$
row 6 6 $1\frac12$
 

Problem 3 (from Unit 2, Lesson 7)

Decide whether each table could represent a proportional relationship. If the relationship could be proportional, what would be the constant of proportionality?

  1. The sizes you can print a photo

    row 1 width of photo (inches) height of photo (inches)
    row 2 2 3
    row 3 4 6
    row 4 5 7
    row 5 8 10
  2. The distance from which a lighthouse is visible.

    row 1 height of a lighthouse (feet) distance it can be seen (miles)
    row 2 20 6
    row 3 45 9
    row 4 70 11
    row 5 95 13
    row 6 150 16

Problem 4 (from Unit 2, Lesson 9)

Select all of the pieces of information that would tell you $x$ and $y$ have a proportional relationship. Let $y$ represent the distance between a rock and a turtle's current position in meters and $x$ represent the number of minutes the turtle has been moving.

  1. $y = 3x$
  2. After 4 minutes, the turtle has walked 12 feet away from the rock.
  3. The turtle walks for a bit, then stops for a minute before walking again.
  4. The turtle walks away from the rock at a constant rate.

Lesson 11

Problem 1

There is a proportional relationship between the number of months a person has had a streaming movie subscription and the total amount of money they have paid for the subscription. The cost for 6 months is \$47.94. The point $(6, 47.94)$ is shown on the graph below.
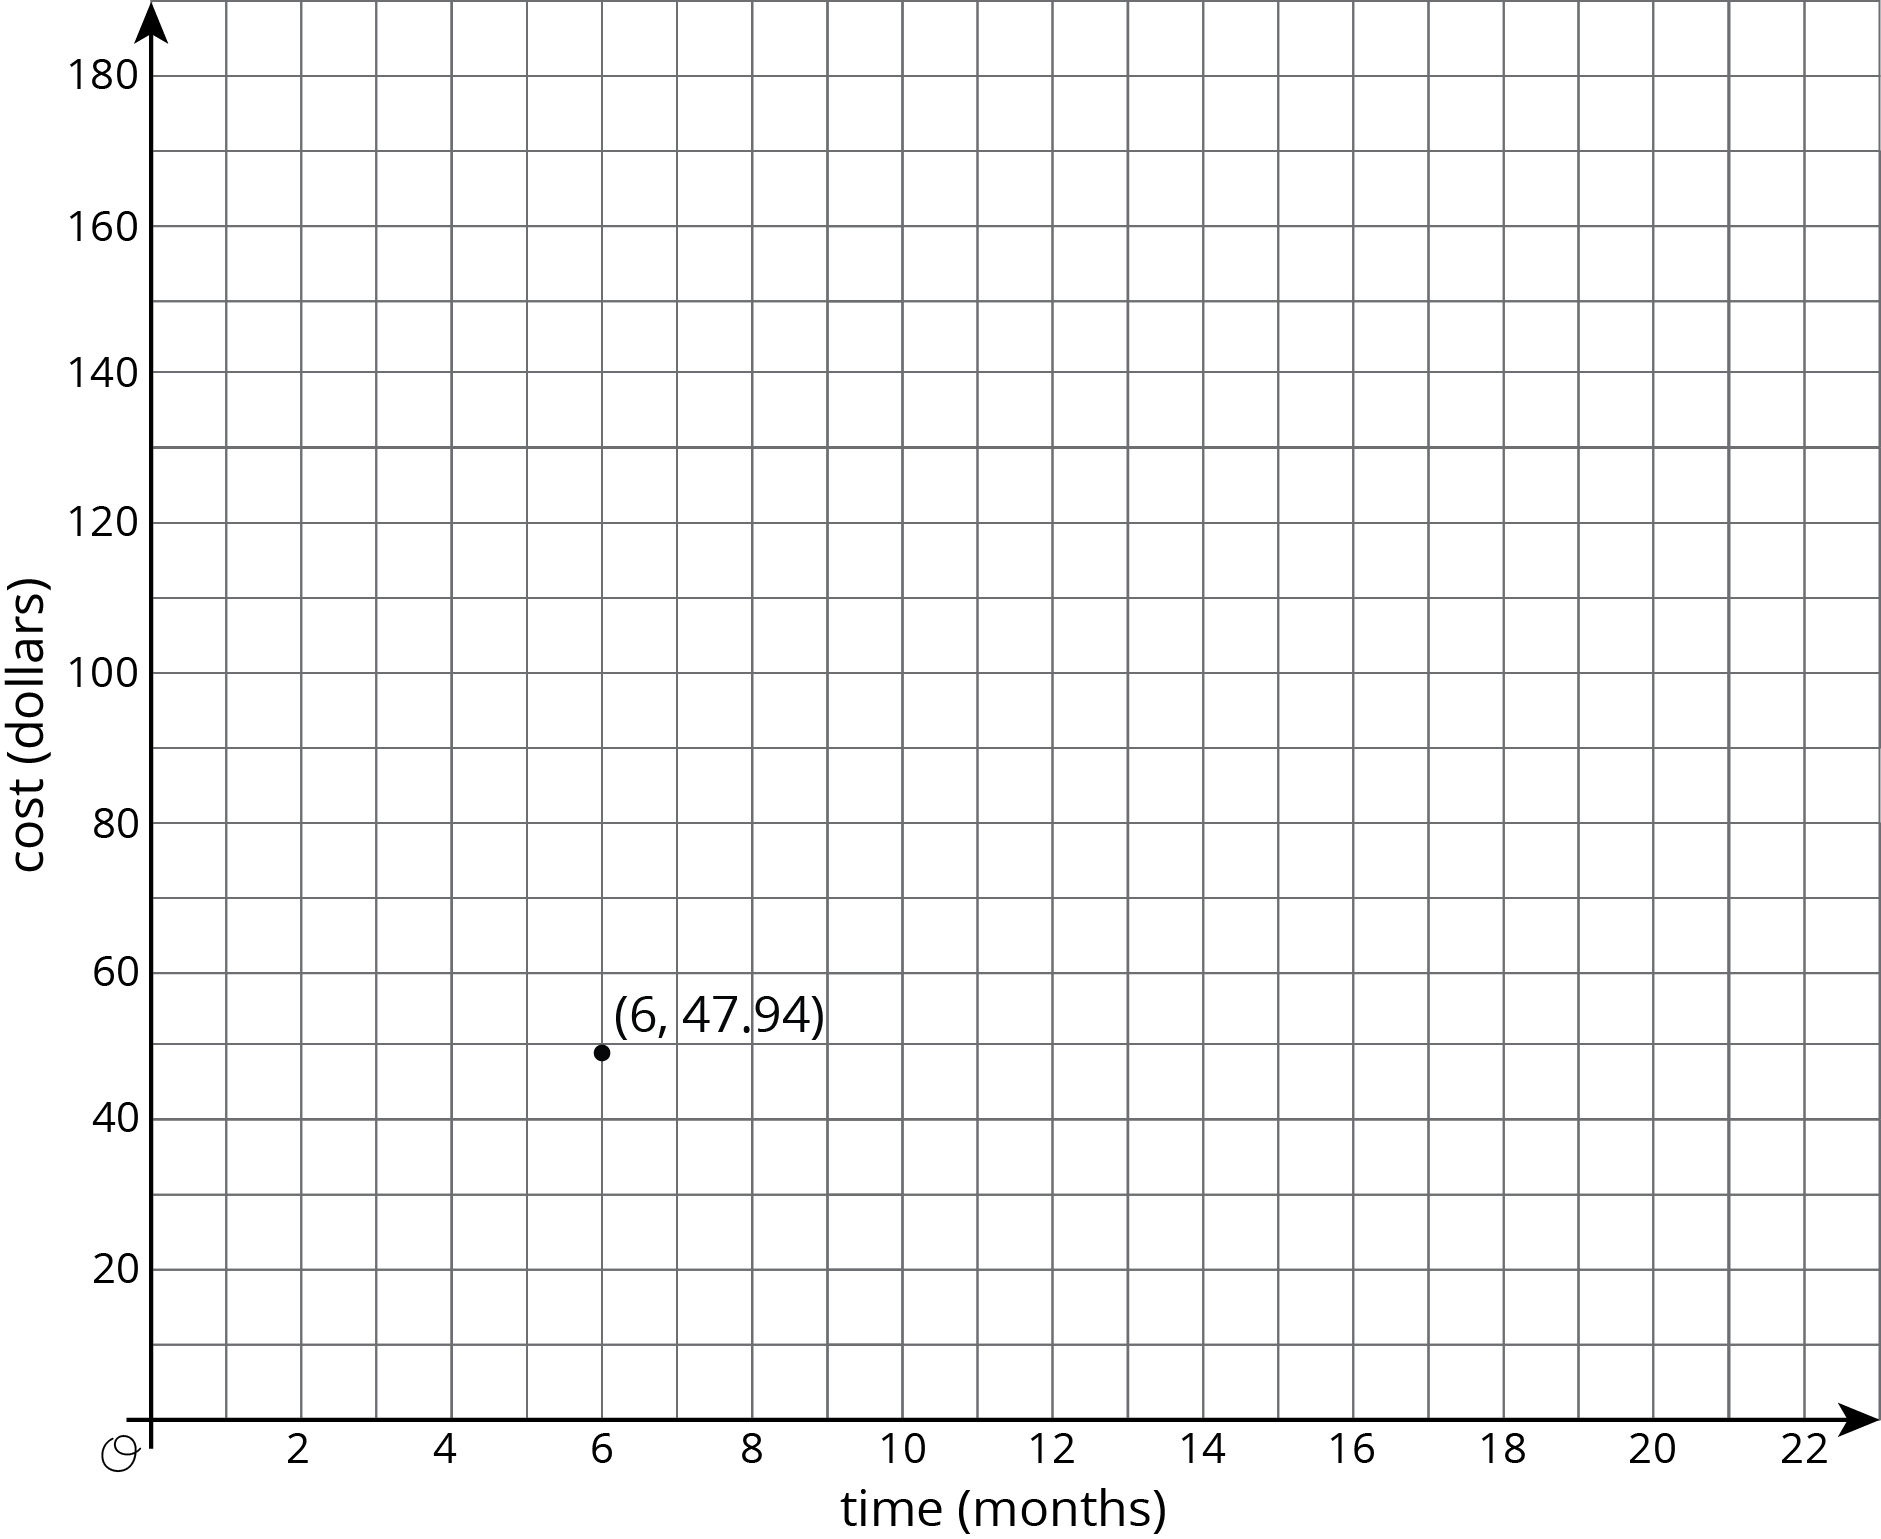
A coordinate plane with the origin labeled “O”. The horizontal axis is labeled “time in months” and the numbers 0 through 22 are indicated. The vertical axis is labeled “cost in dollars” and the numbers 0 through 180, in increments of 10, are indicated. The point with coordinates 6 comma 47.94 is indicated.
  1. What is the constant of proportionality in this relationship?
  2. What does the constant of proportionality tell us about the situation?
  3. Add at least three more points to the graph and label them with their coordinates.
  4. Write an equation that represents the relationship between $C$, the total cost of the subscription, and $m$, the number of months.

Problem 2

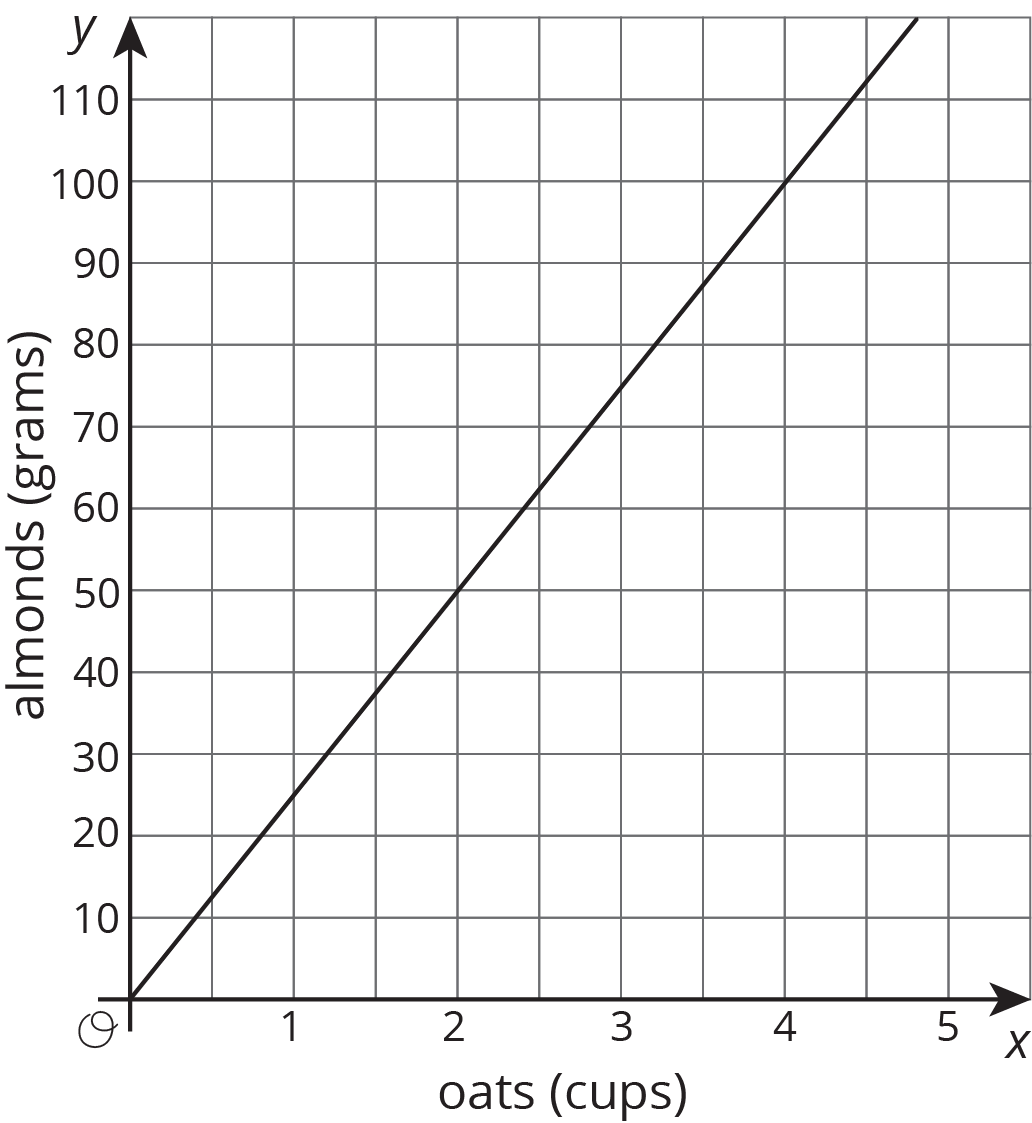
The graph shows the amounts of almonds, in grams, for different amounts of oats, in cups, in a granola mix. Label the point $(1, k)$ on the graph, find the value of $k$, and explain its meaning.
Problem 3 (from Unit 2, Lesson 9)

To make a friendship bracelet, some long strings are lined up then taking one string and tying it in a knot with each of the other strings to create a row of knots. A new string is chosen and knotted with the all the other strings to create a second row. This process is repeated until there are enough rows to make a bracelet to fit around your friend's wrist.

Are the number of knots proportional to the number of rows? Explain your reasoning.

Problem 4 (from Unit 2, Lesson 9)

What information do you need to know to write an equation relating two quantities that have a proportional relationship?

Lesson 12

Problem 1

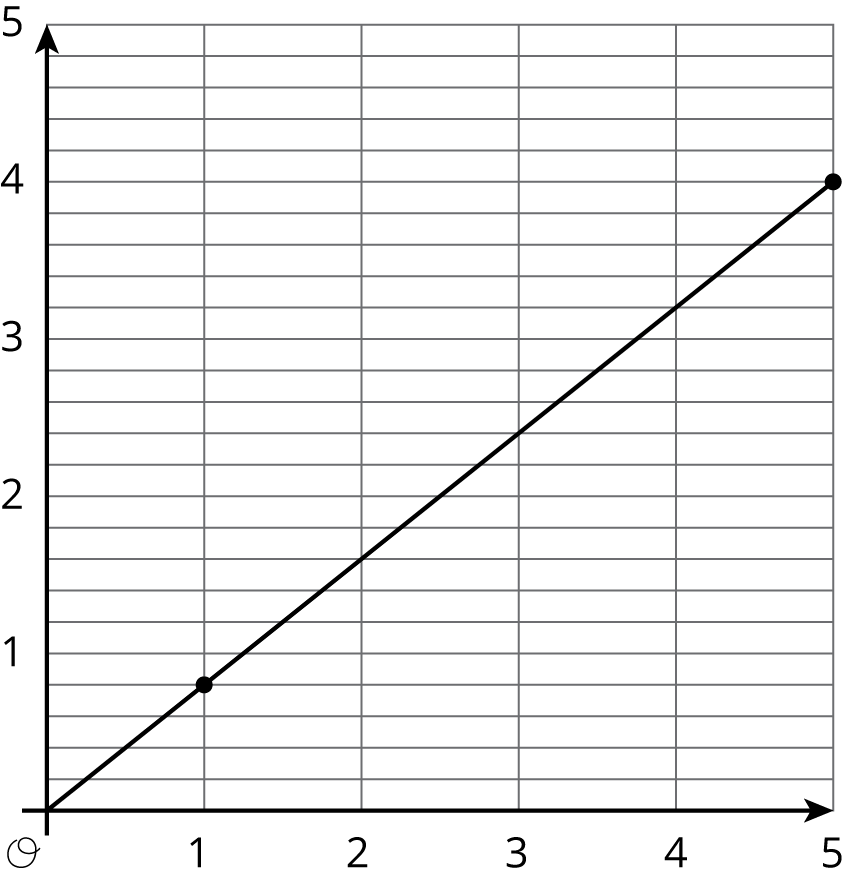
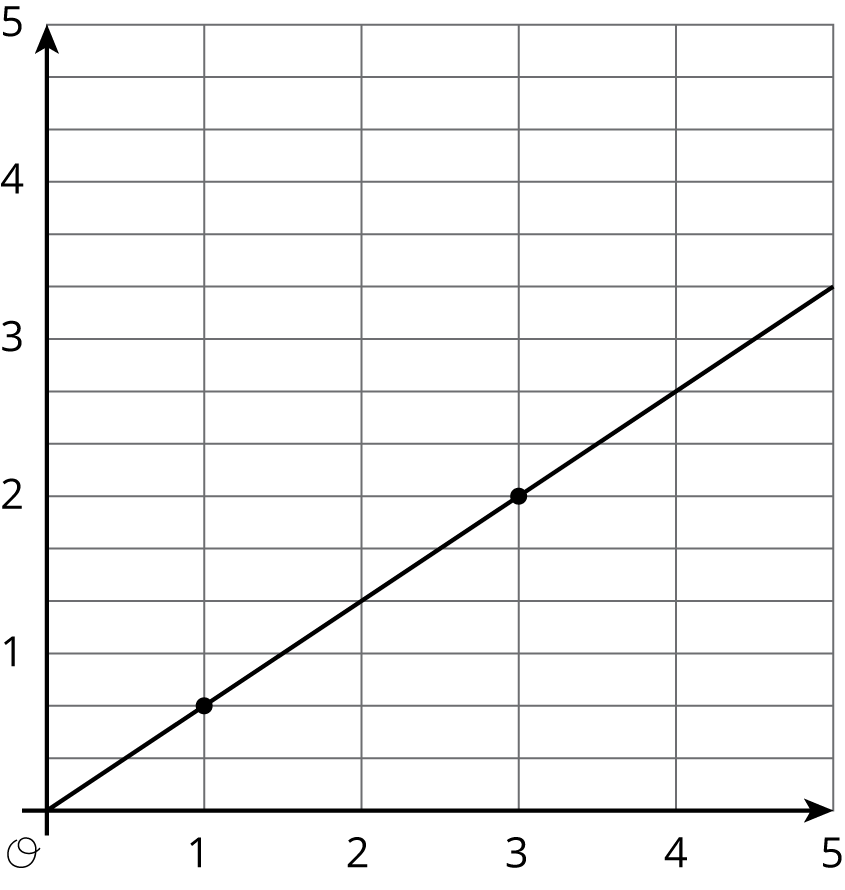
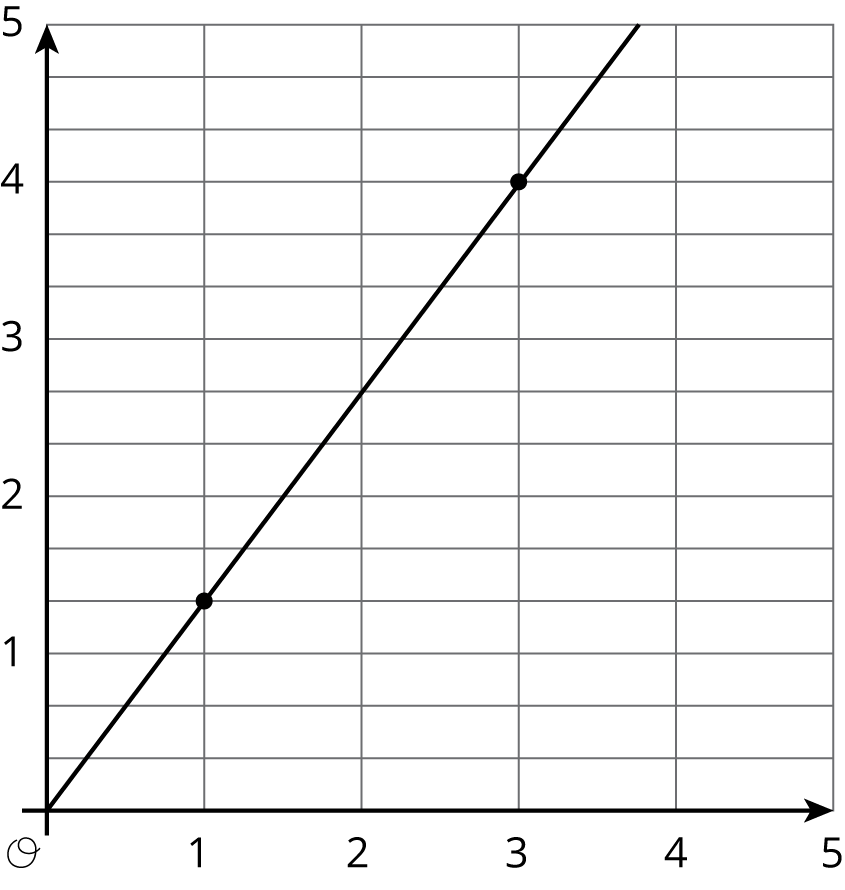
Match each equation to its graph.

  1. $y = 2x$
  2. $y = \frac45 x$
  3. $y = \frac14 x$
  4. $y = \frac23 x$
  5. $y = \frac43 x$
  6. $y = \frac32 x$

1

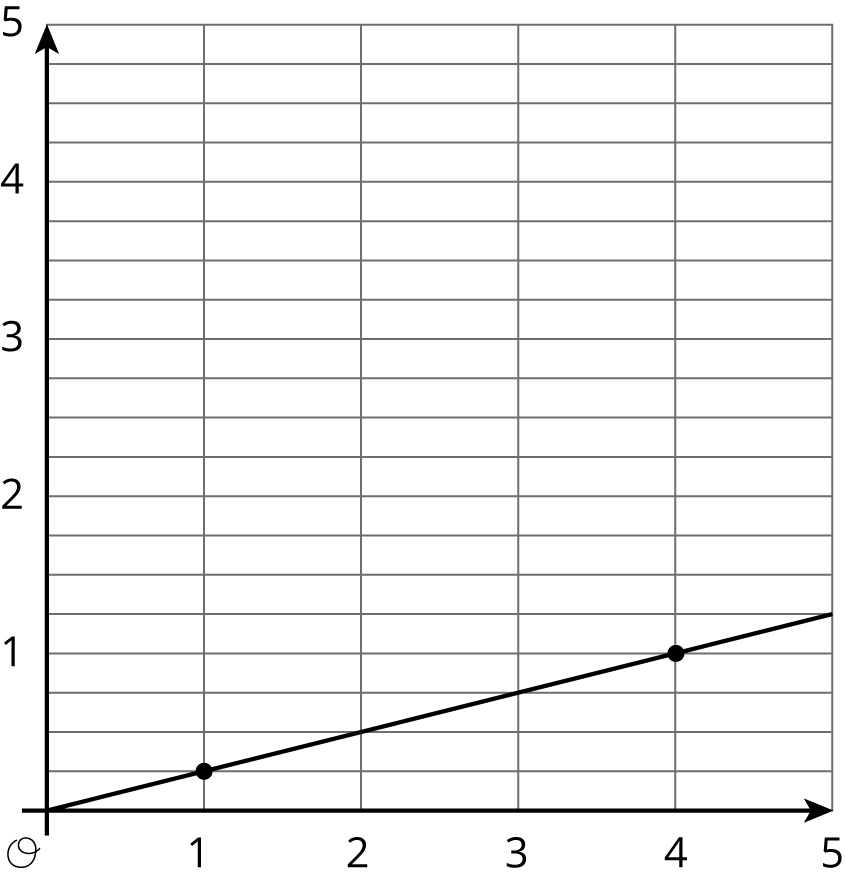
A line is graphed in the coordinate plane with the origin labeled “O”. The numbers 0 through 5 are indicated on the horizontal axis. The numbers 0 through 5, are indicated on the vertical axis. The line begins at the origin. It moves steadily upwards and to the right passing through the points with coordinates 1 comma four fifths, and 5 comma 4.

2

Graph 2 is a line graphed in the coordinate plane with the origin labeled “O”. The numbers 0 through 5 are indicated on the horizontal axis. The numbers 0 through 5 on the vertical axis. There are two evenly spaced horizontal gridlines between each integer. The line begins at the origin. It moves steadily upward and to the right passing through the points with coordinates 1 comma two-thirds, and 3 comma 2.

3

Graph 3 is a line graphed in the coordinate plane with the origin labeled “O”. The numbers 0 through 5 are indicated on the horizontal axis. The numbers 0 through 5 are indicated on the vertical axis. There are 2 evenly spaced horizontal gridlines between each integer. The line begins at the origin. It moves steadily upward and to the right passing through the points with coordinates 1 comma 1 and one-third, and 3 comma 4.

4

Graph 4 is a line graphed in the coordinate plane with the origin labeled “O”. The numbers 0 through 5 are indicated on the horizontal axis. The numbers 0 through 5 are indicated on the vertical axis. There are three evenly spaced horizonatal gridlines between each interger. The line begins at the origin. It moves gradually upwards and to the right passing through the points with coordinates 1 comma one-fourth, and 4 comma 1.

5

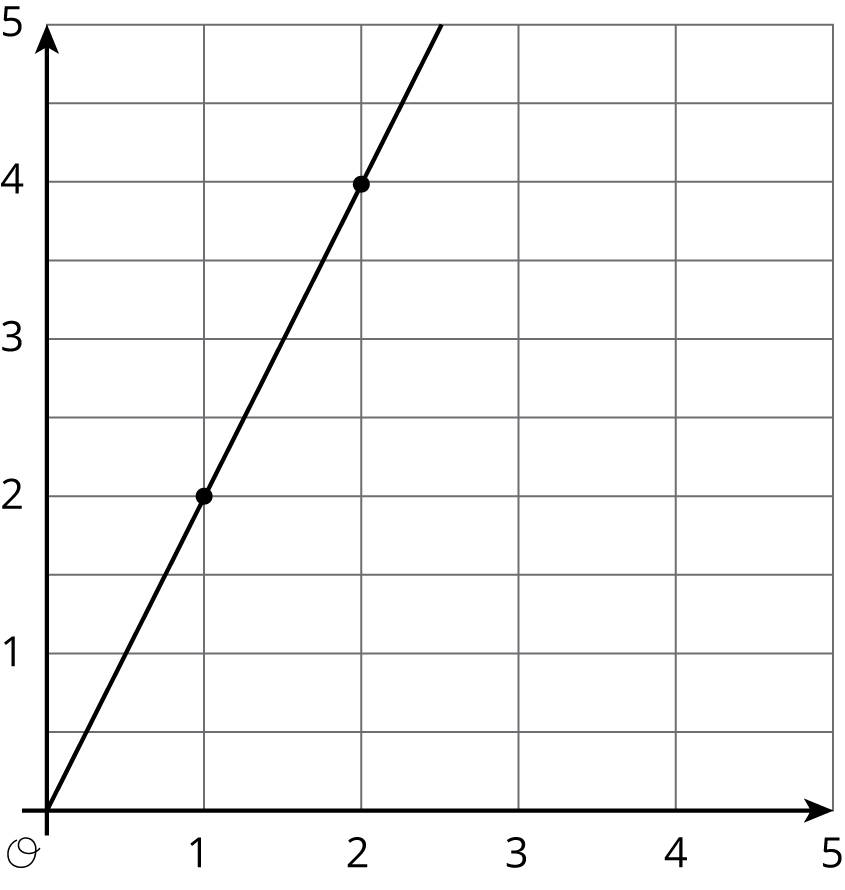
Graph 5 is a line graphed in the coordinate plane with the origin labeled “O”. The numbers 0 through 5 are indicated on the horizontal axis. The numbers 0 through 5 are indicated on the vertical axis. There are also horizontal gridlines midway between each integer. The line begins at the origin. It moves steeply upward and to the right, passing through the points with coordinates 1 comma 2, and 2 comma 4.

6

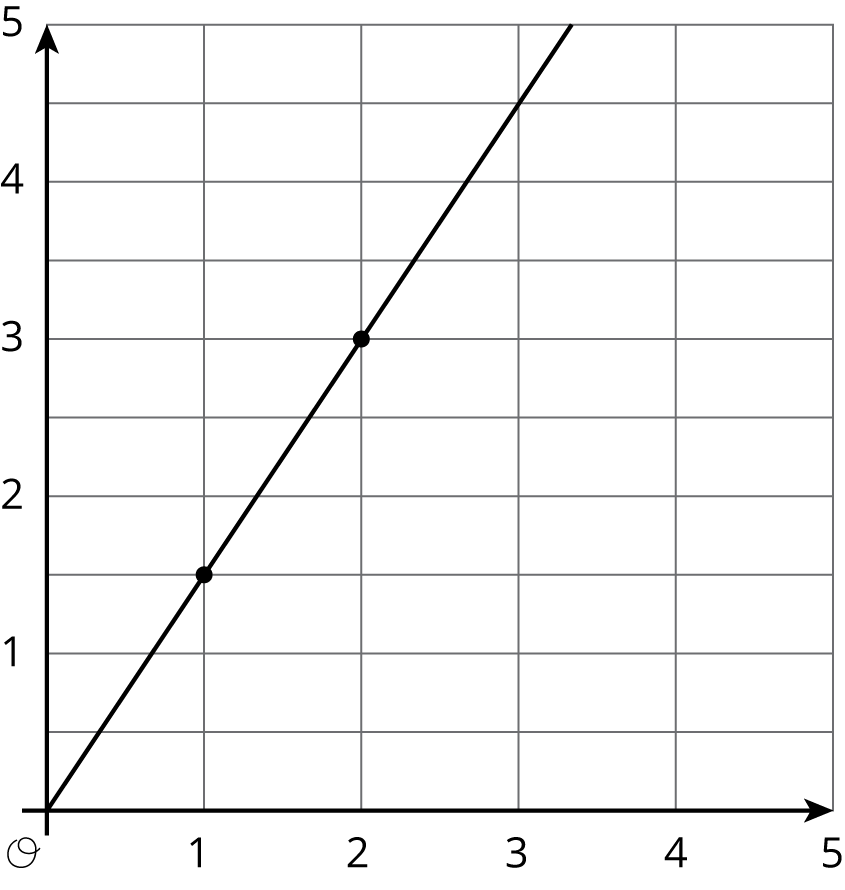
Graph 6 is a line graphed in the coordinate plane with the origin labeled “O”. The numbers 0 through 5 are indicated on the horizontal axis. The numbers 0 through 5 are indicated on the vertical axis. There are horizontal gridlines midway between each integer. The line begins at the origin. It moves steadily upward and to the right, passing through the points with coordinates 1 comma 1 point 5 and 2 comma 3.


Problem 2

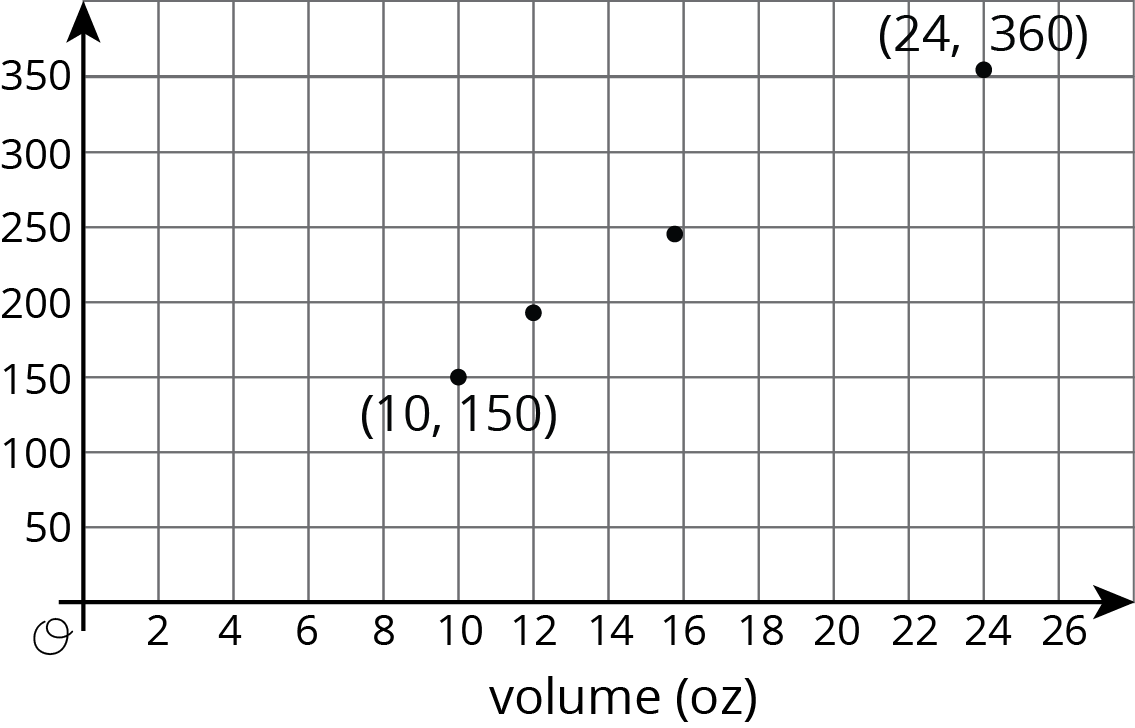
The graphs below show some data from a coffee shop menu. One of the graphs shows cost (in dollars) vs. drink volume (in ounces), and one of the graphs shows calories vs. drink volume (in ounces).

__________________ vs volume
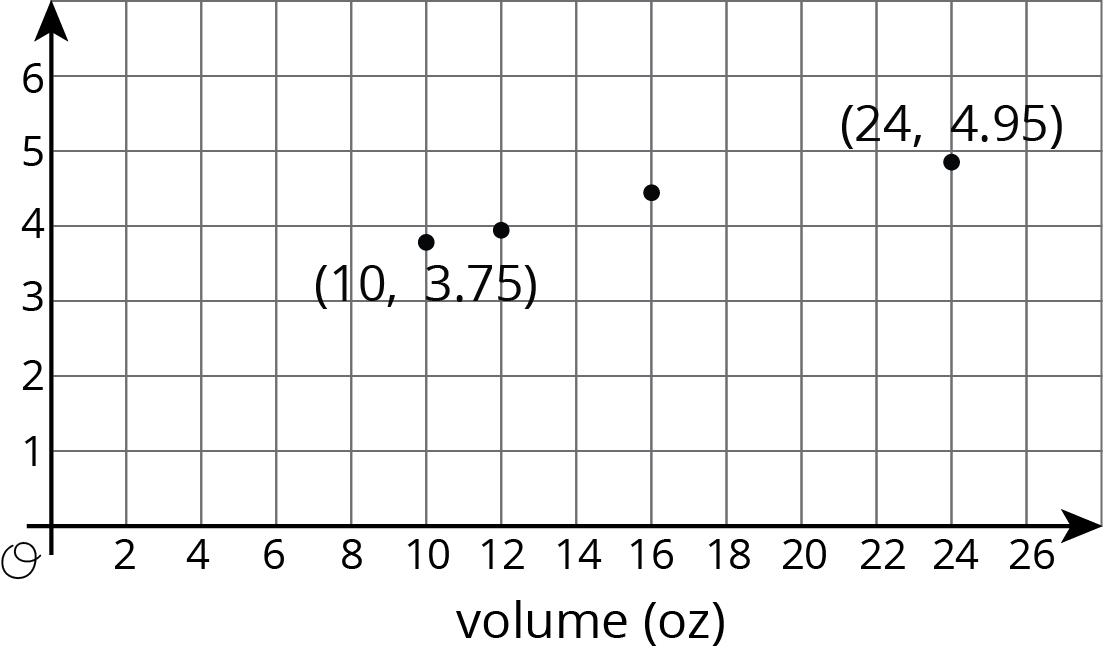
A coordinate plane with the origin labeled “O”. The horizontal axis is labeled “volume in ounces” and the numbers 0 through 26, in increments of 2, are indicated. The vertical axis has the numbers 0 through 6 indicated. The points with coordinates 10 comma 3 point 7 5, 12 comma 4, 16 comma 4 point 5, and 24 comma 4 point 9 5 are indicated.

_____________________ vs volume

A coordinate plane with the origin labeled “O”. The horizontal axis is labeled “volume in ounces” and the numbers 0 through 26, in increments of 2, are indicated. The vertical axis has the numbers 0 through 350, in increments of 50 indicated. The points 10 comma 150, 12 comma 180, 15 point 9 comma 2 hundred 38 point 5, and 24 comma 360 are indicated.
  1. Which graph is which? Give them the correct titles.
  2. Which quantities appear to be in a proportional relationship? Explain how you know.
  3. For the proportional relationship, find the constant of proportionality. What does that number mean?

Problem 3

Lin and Andre biked home from school at a steady pace. Lin biked 1.5 km and it took her 5 minutes. Andre biked 2 km and it took him 8 minutes. 

  1. Draw a graph with two lines that represent the bike rides of Lin and Andre. 
  2. For each line, highlight the point with coordinates $(1,k)$ and find $k$.
  3. Who was biking faster?

Lesson 13

Problem 1

At the supermarket you can fill your own honey bear container. A customer buys 12 oz of honey for \$5.40.
  1. How much does honey cost per ounce?
  2. How much honey can you buy per dollar?
  3. Write two different equations that represent this situation. Use $h$ for ounces of honey and $c$ for cost in dollars.

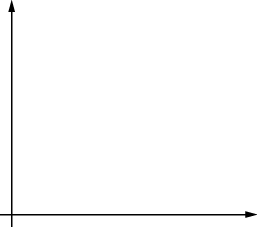
A blank set of coordinate axes.

  1. Choose one of your equations, and sketch its graph. Be sure to label the axes. 

Problem 2

The point $(3, \frac65)$ lies on the graph representing a proportional relationship. Which of the following points also lie on the same graph? Select all that apply.

  1. $(1, 0.4)$
  2. $(1.5, \frac{6}{10})$
  3. $(\frac65, 3)$
  4. $(4, \frac{11}{5})$
  5. $(15, 6)$

Problem 3

A trail mix recipe asks for 4 cups of raisins for every 6 cups of peanuts. There is proportional relationship between the amount of raisins, $r$ (cups), and the amount of peanuts, $p$ (cups), in this recipe. 

  1. Write the equation for the relationship that has constant of proportionality greater than 1. Graph the relationship.
  2. Write the equation for the relationship that has constant of proportionality less than 1. Graph the relationship.

Problem 4 (from Unit 2, Lesson 11)

Here is a graph that represents a proportional relationship.
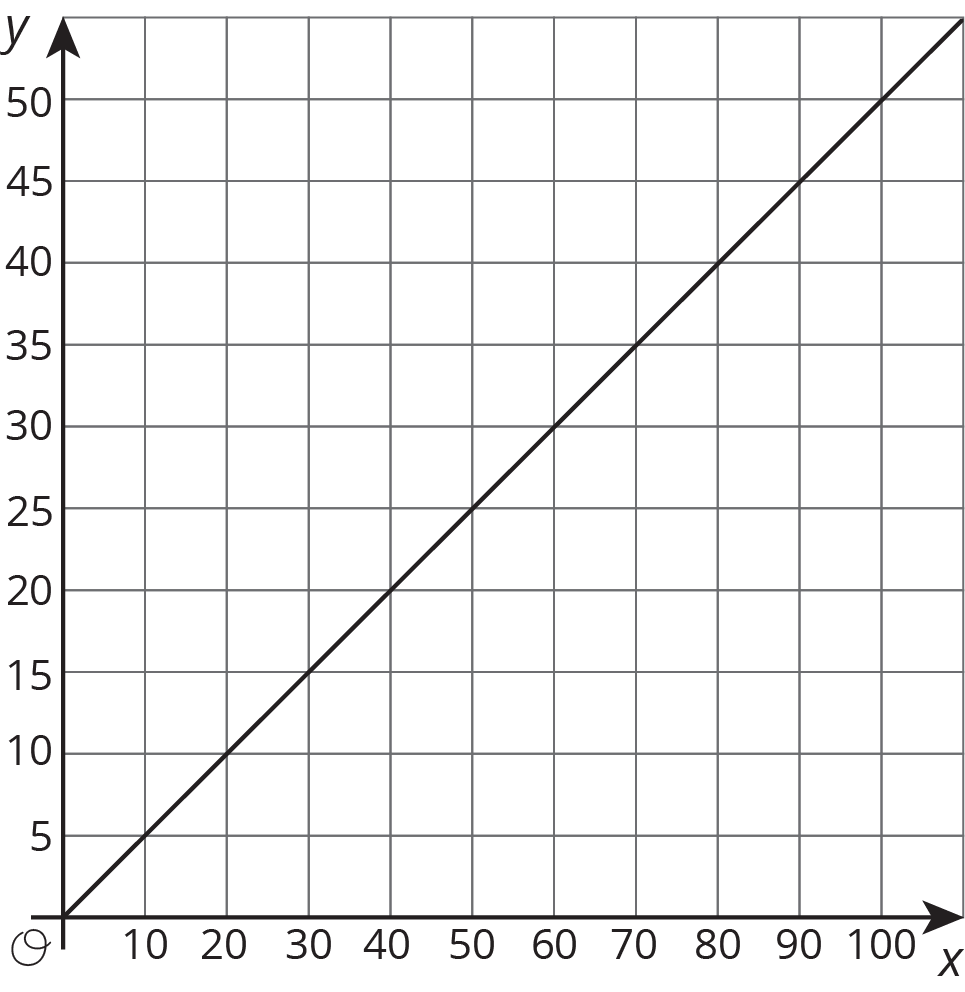
  1. Come up with a situation that could be represented by this graph.
  2. Label the axes with the quantities in your situation.
  3. Give the graph a title.
  4. Choose a point on the graph. What do the coordinates represent in your situation?

A line is graphed in the coordinate plane with the origin labeled “O”. The x axis has the numbers 0 through 20, in increments of 2, indicated. The y axis has the numbers 0 through 20, in increments of 2, indicated. The line begins at the origin. It moves gradually upward and to the right passing through the point with coordinates 8 comma 6. There is also a point indicated on the line and the coordinates of that point have integer values.

Lesson 14

Problem 1

The equation $c = 2.95g$ shows how much it costs to buy gas at a gas station on a certain day. In the equation, $c$ represents the cost in dollars, and $g$ represents how many gallons of gas were purchased.

  1. Write down at least four (gallons of gas, cost) pairs that fit this relationship.
  2. Create a graph of the relationship.
  3. What does 2.95 represent in this situation?
  4. Jada’s mom remarks, “You can get about a third of a gallon of gas for a dollar.” Is she correct? How did she come up with that?

Problem 2

There is a proportional relationship between a volume measured in cups and the same volume measured in tablespoons. 3 cups is equivalent to 48 tablespoons, as shown in the graph.
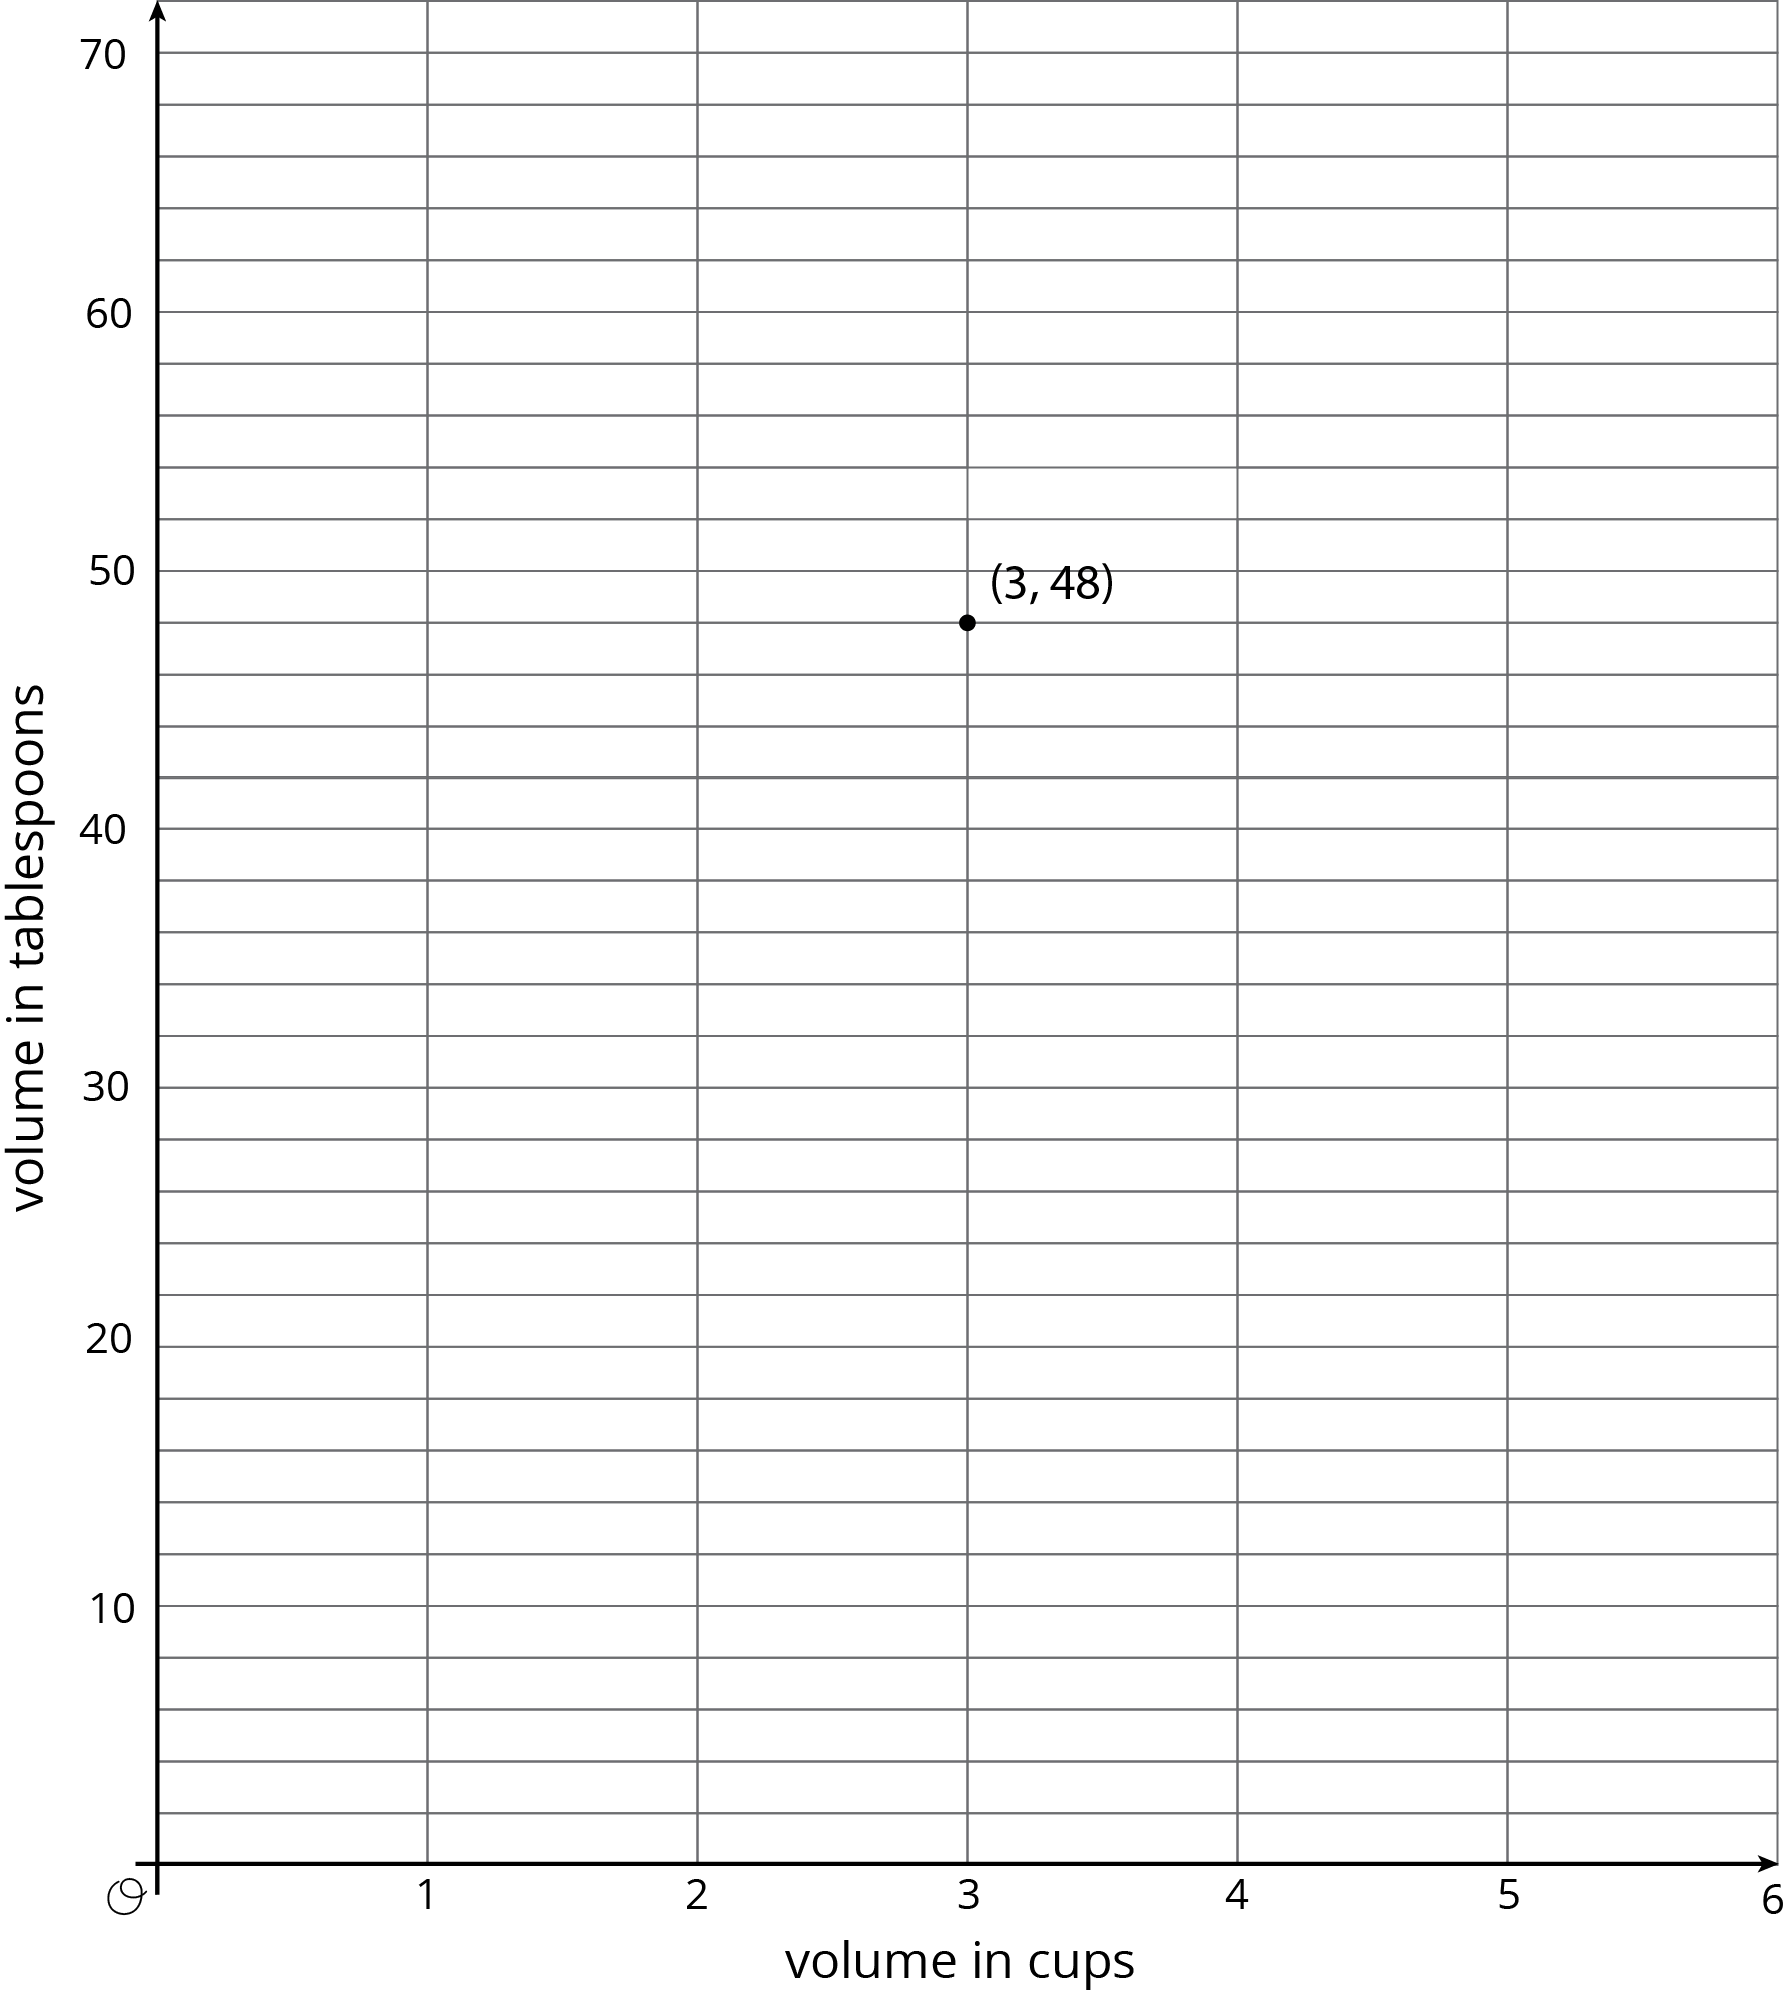
  1. Plot and label at least two more points that represent the relationship.
  2. Use a straightedge to draw a line that represents this proportional relationship.
  3. For which value y is ($1, y$) on the line you just drew?
  4. What is the constant of proportionality for this relationship?
  5. Write an equation representing this relationship. Use $c$ for cups and $t$ for tablespoons.
A point plotted in the coordinate plane with the origin labeled “O”. The horizontal axis is labeled “volume in cups” and the numbers 0 through 6 are indicated. The vertical axis is labeled “volume in tablespoons” and the numbers 0 through 70, in increments of 10, are indicated. There are four evenly spaced horizontal gridlines between each number indicated. The point with coordinates 3 comma 48 is indicated.

Lesson 15

No practice problems for this lesson.