8.1: Bigger and Smaller
Diego said that these graphs are ordered from smallest to largest. Mai said they are ordered from largest to smallest. But these are graphs, not numbers! What do you think Diego and Mai are thinking?

Let’s investigate linear functions.
Diego said that these graphs are ordered from smallest to largest. Mai said they are ordered from largest to smallest. But these are graphs, not numbers! What do you think Diego and Mai are thinking?


There are four tanks of water. The amount of water in gallons, $A$, in Tank A is given by the function $A = 200 + 8t$, where $t$ is in minutes. The amount of water in gallons, $B$, in Tank B starts at 400 gallons and is decreasing at 5 gallons per minute. These functions work when $t \geq 0$ and $t \leq 80$.

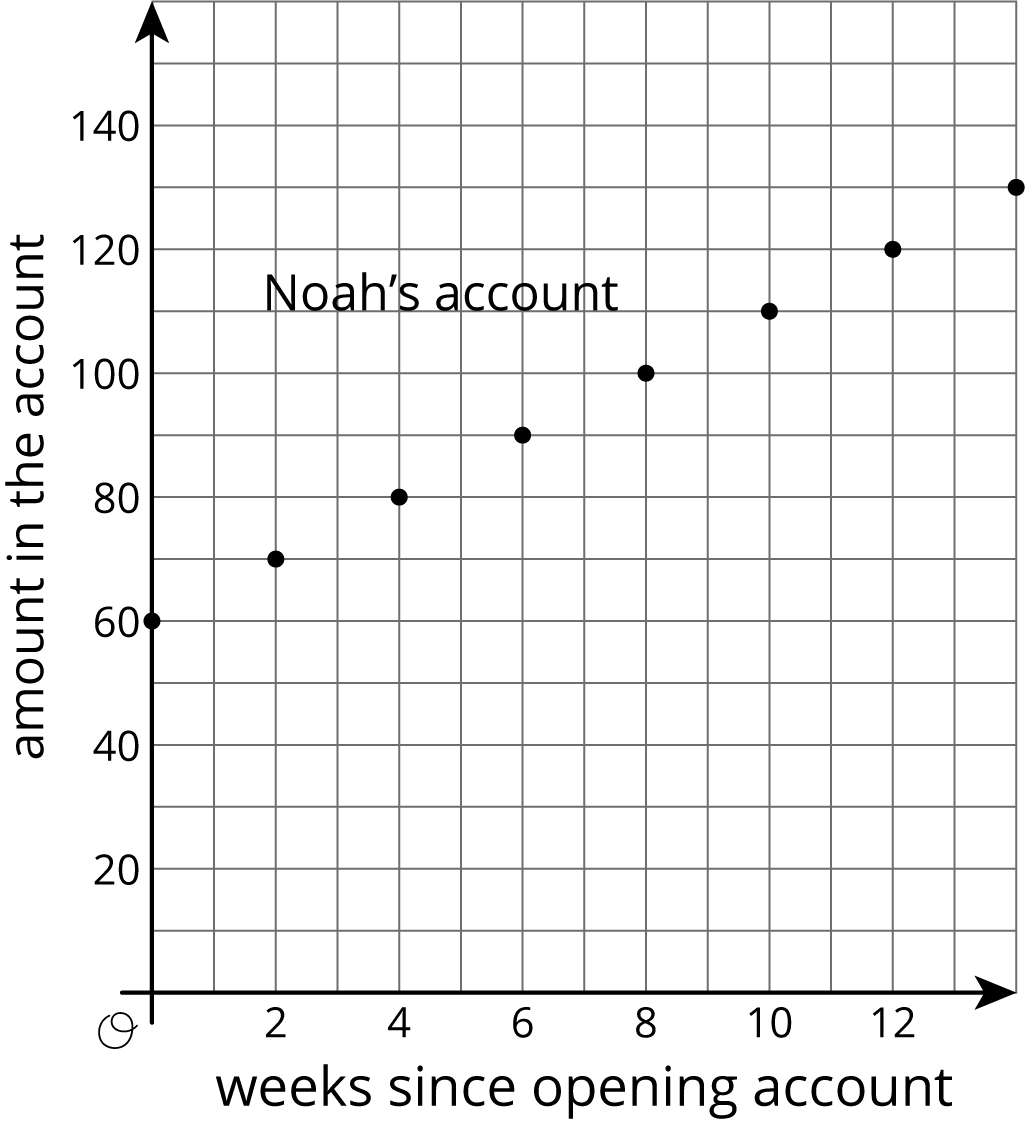
Noah is depositing money in his account every week to save money. The graph shows the amount he has saved as a function of time since he opened his account.
Elena opened an account the same day as Noah. The amount of money $E$ in her account is given by the function $E=8w+60$, where $w$ is the number of weeks since the account was opened.
Suppose a car is traveling at 30 miles per hour. The relationship between the time in hours and the distance in miles is a proportional relationship. We can represent this relationship with an equation of the form $d = 30t$, where distance is a function of time (since each input of time has exactly one output of distance). Or we could write the equation $t = \frac{1}{30} d$ instead, where time is a function of distance (since each input of distance has exactly one output of time).
More generally, if we represent a linear function with an equation like $y = mx + b$, then $b$ is the initial value (which is 0 for proportional relationships), and $m$ is the rate of change of the function. If $m$ is positive, the function is increasing. If $m$ is negative, the function is decreasing. If we represent a linear function in a different way, say with a graph, we can use what we know about graphs of lines to find the $m$ and $b$ values and, if needed, write an equation.