Lesson 9: Linear Models

Let’s model situations with linear functions.

9.1: Candlelight

A candle is burning. It starts out 12 inches long. After 1 hour, it is 10 inches long. After 3 hours, it is 5.5 inches long.

  1. When do you think the candle will burn out completely?
  2. Is the height of the candle a function of time? If yes, is it a linear function? Explain your thinking.

This tool is here for you to use if you choose. To plot a point, type its coordinates. For example, try typing $(1,2)$. To graph a line, type its equation. Try typing $y=2x-3$. You can delete anything by clicking on the X next to it.


9.2: Shadows

When the sun was directly overhead, the stick had no shadow. After 20 minutes, the shadow was 10.5 cm long. After 60 minutes, it was 26 cm long.

  1. Based on this information, estimate how long it will be after 95 minutes.
  2. After 95 minutes, the shadow measured 38.5 cm. How does this compare to your estimate?
  3. Is the length of the shadow a function of time? If so, is it linear? Explain your thinking.

This tool is here for you to use if you choose. To plot a point, type its coordinates. For example, try typing $(3,5)$. To graph a line, type its equation. Try typing $y=2x+7$. You can delete anything by clicking on the X next to it.


9.3: Recycling

In an earlier lesson, we saw this graph that shows the percentage of all garbage in the U.S. that was recycled between 1991 and 2013.

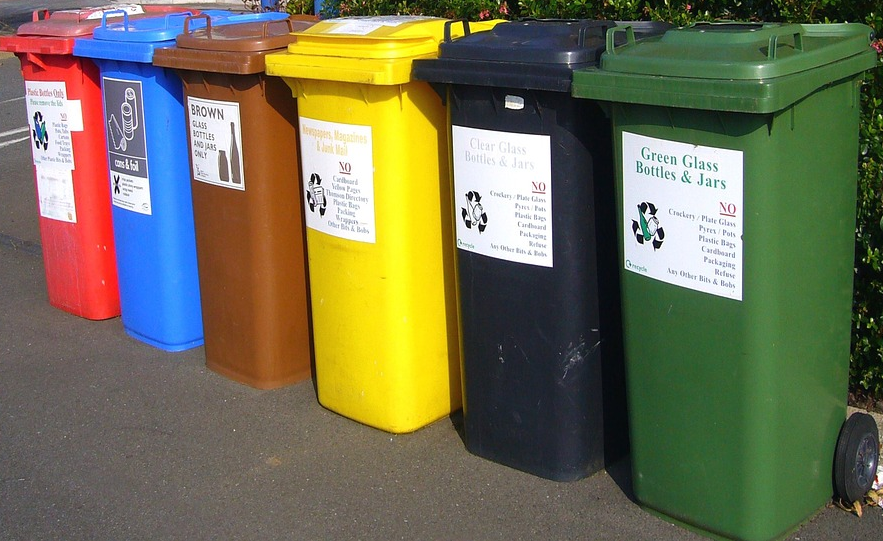
Recycling Bins Copyright Owner: 9355 License: Public Domain Via: Pixabay

  1. Sketch a linear function that models the change in the percentage of garbage that was recycled between 1991 and 1995. For which years is the model good at predicting the percentage of garbage that is produced? For which years is it not as good?
  2. Pick another time period to model with a sketch of a linear function. For which years is the model good at making predictions? For which years is it not very good?

Summary

Water has different boiling points at different elevations. At 0 m above sea level, the boiling point is $100^\circ$ C. At 2,500 m above sea level, the boiling point is 91.3$^\circ$ C. If we assume the boiling point of water is a linear function of elevation, we can use these two data points to calculate the slope of the line: $$m=\frac{91.3-100}{2,\!500-0}=\frac{\text-8.7}{2,\!500}$$

This slope means that for each increase of 2,500 m, the boiling point of water decreases by $8.7^\circ$ C. Next, we already know the $y$-intercept is $100^\circ$ C from the first point, so a linear equation representing the data is $$y=\frac{\text-8.7}{2,\!500}x+100$$

This equation is an example of a mathematical model. A mathematical model is a mathematical object like an equation, a function, or a geometric figure that we use to represent a real-life situation. Sometimes a situation can be modeled by a linear function. We have to use judgment about whether this is a reasonable thing to do based on the information we are given. We must also be aware that the model may make imprecise predictions, or may only be appropriate for certain ranges of values.

Testing our model for the boiling point of water, it accurately predicts that at an elevation of 1,000 m above sea level (when $x=1,\!000$), water will boil at $96.5^\circ$ C since $y=\frac{\text-8.7}{2,\!500}\boldcdot 1000+100=96.5$. For higher elevations, the model is not as accurate, but it is still close. At 5,000 m above sea level, it predicts $82.6^\circ$ C, which is $0.6^\circ$ C off the actual value of $83.2^\circ$ C. At 9,000 m above sea level, it predicts $68.7^\circ$ C, which is about $3^\circ$ C less than the actual value of $71.5^\circ$ C. The model continues to be less accurate at even higher elevations since the relationship between the boiling point of water and elevation isn’t linear, but for the elevations in which most people live, it’s pretty good.

Practice Problems ▶