6.1: Estimating Slope
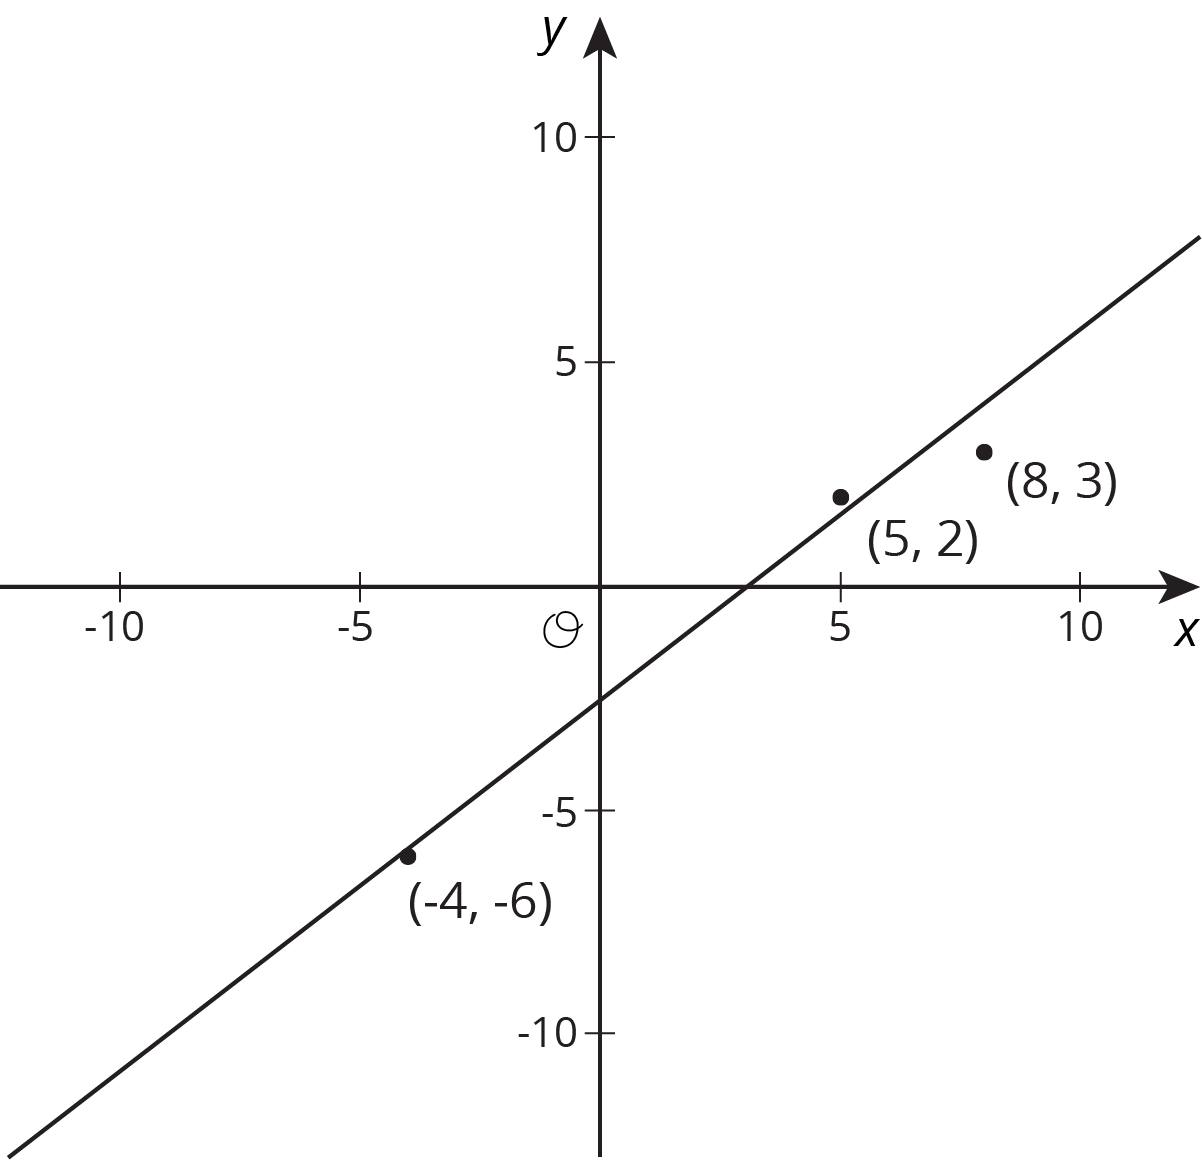
Estimate the slope of the line.
Let's look at how changing one variable changes another.
Estimate the slope of the line.

For each scatter plot, decide if there is an association between the two variables, and describe the situation using one of these sentences:
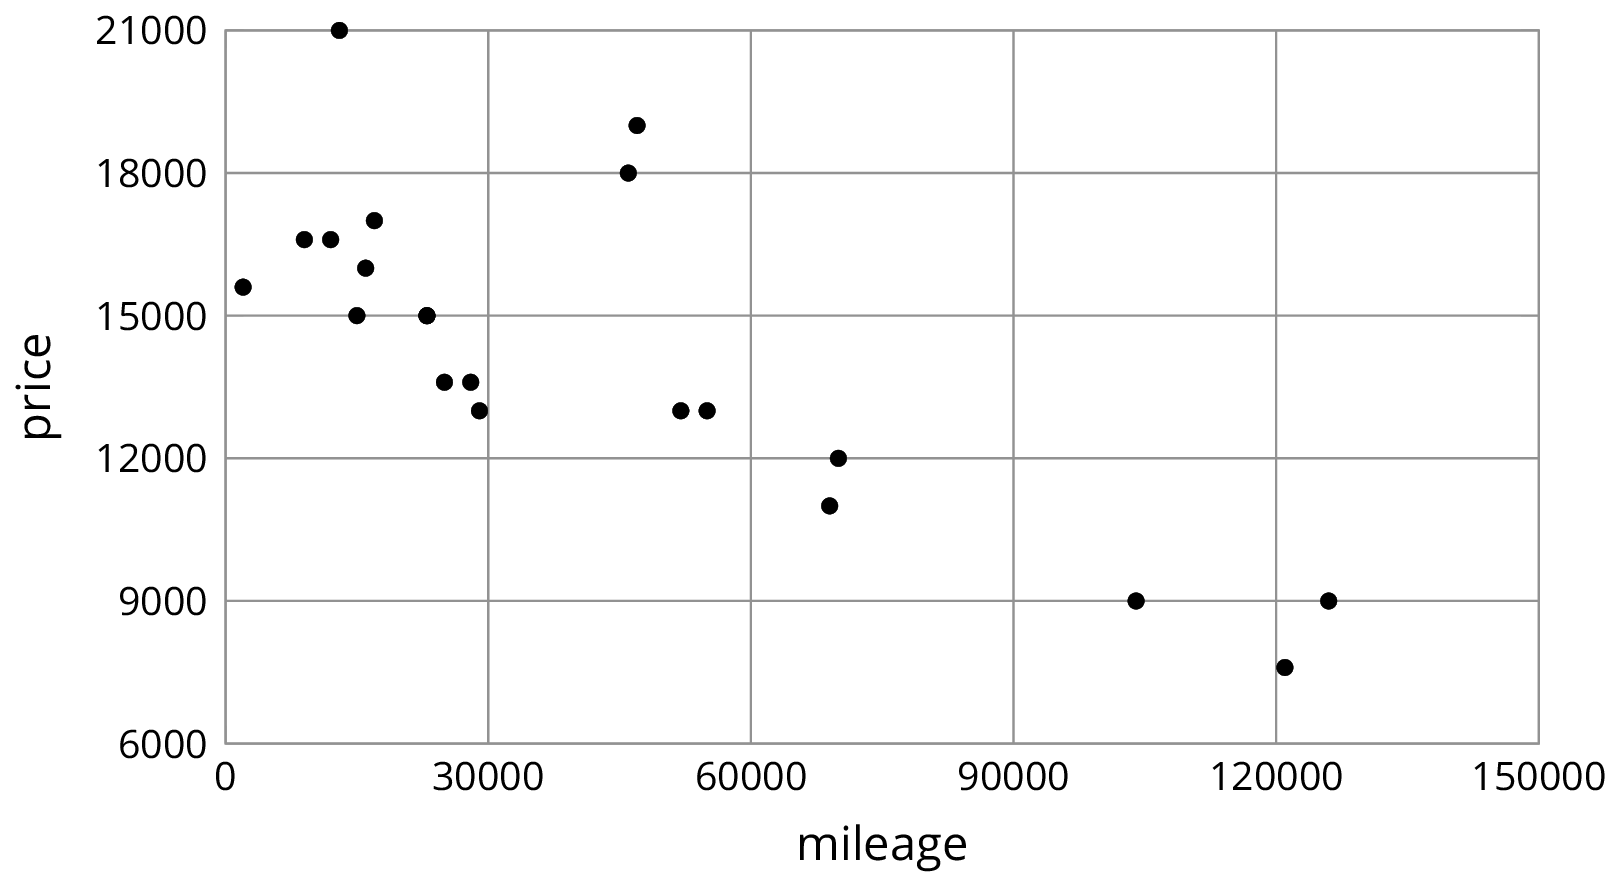
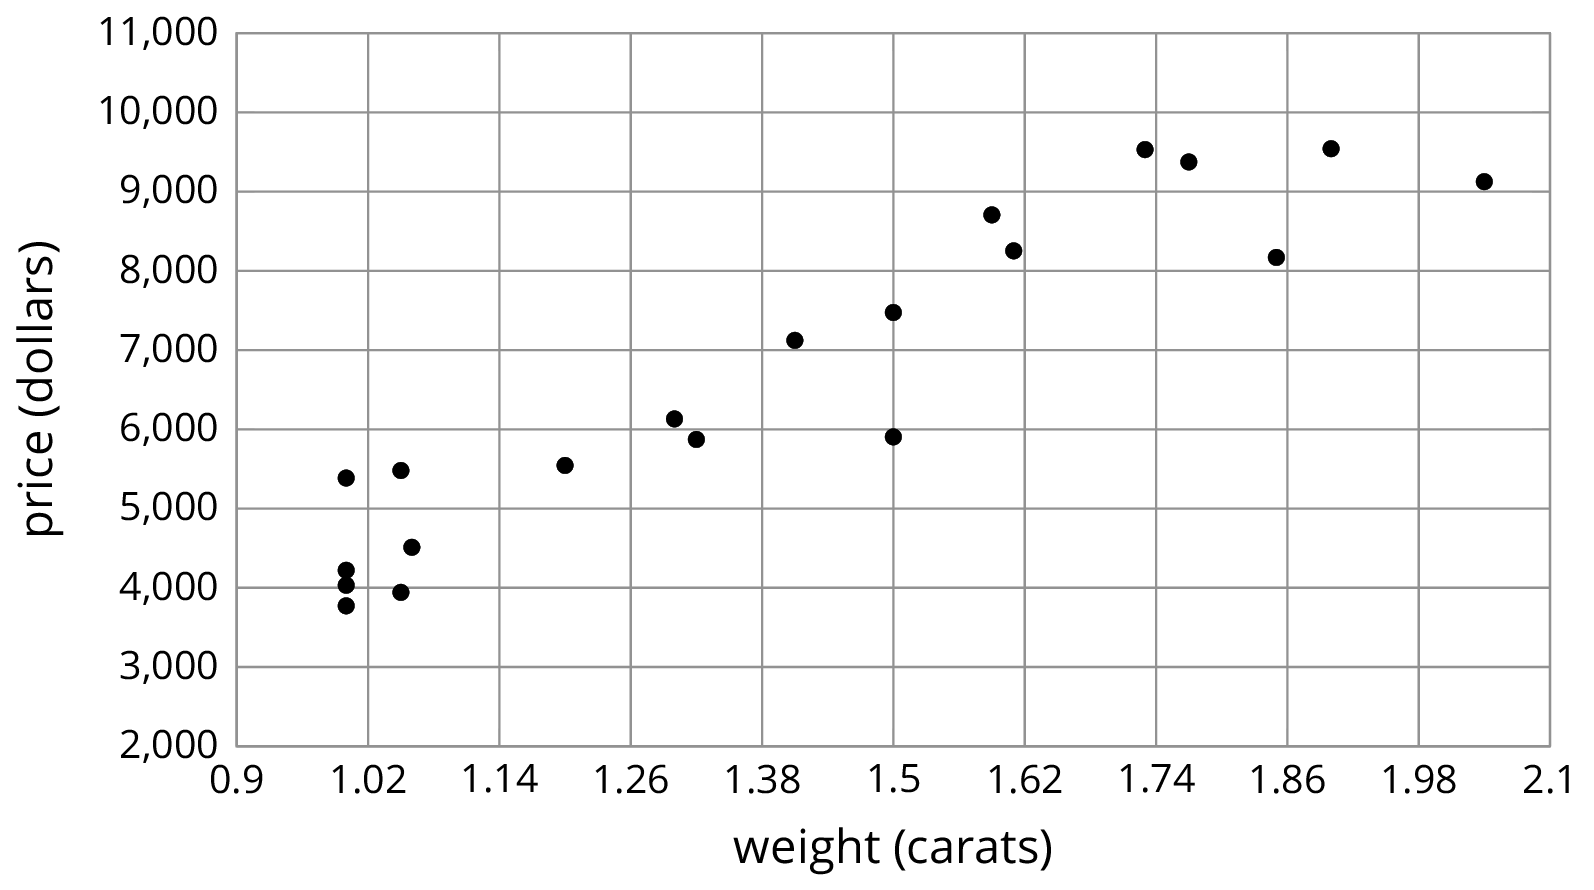
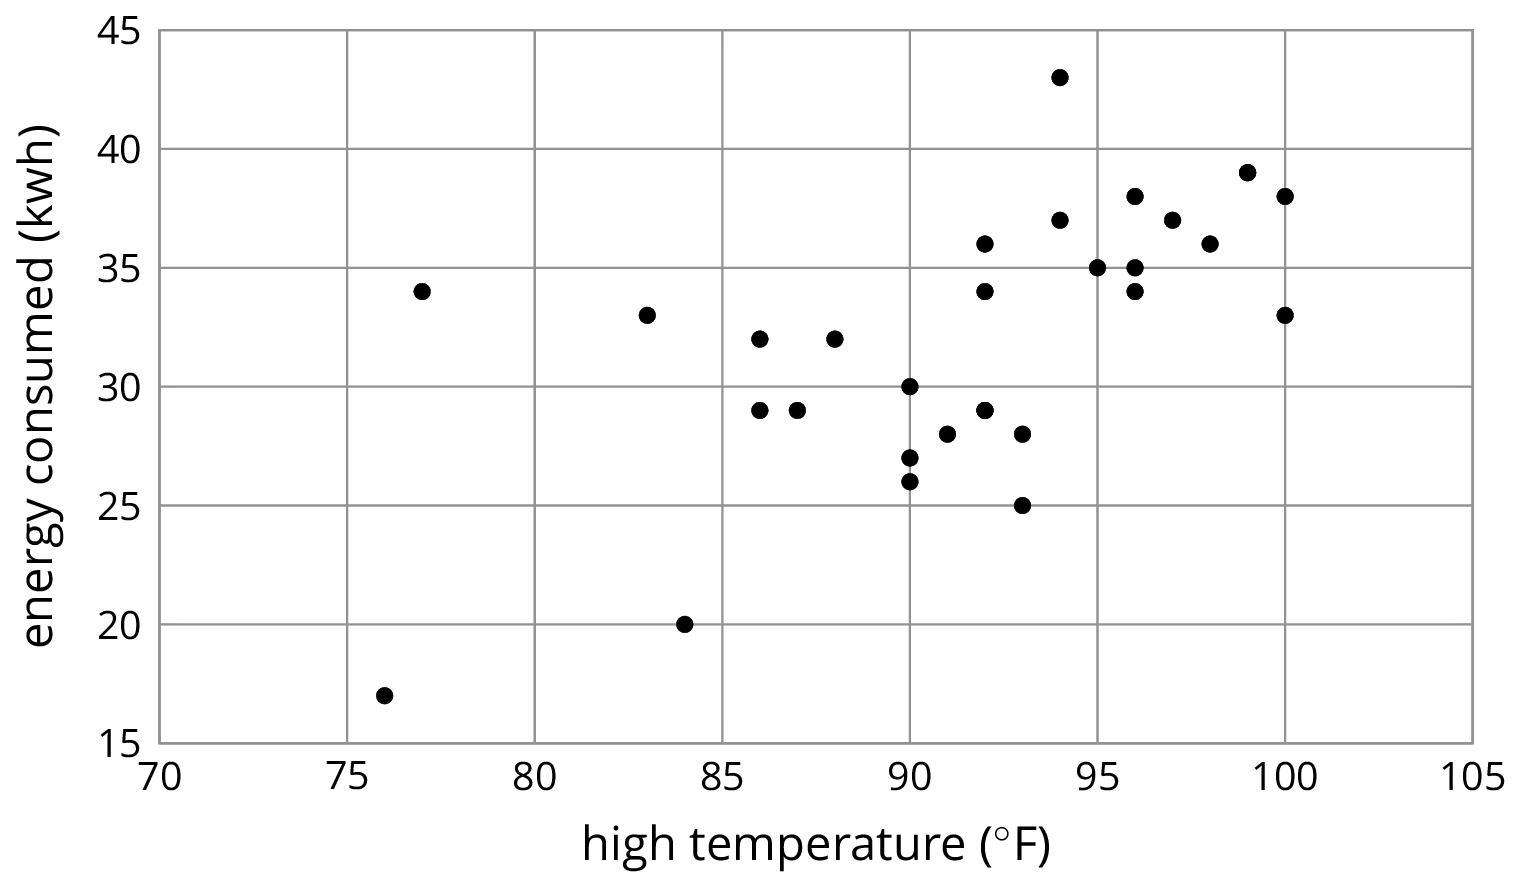
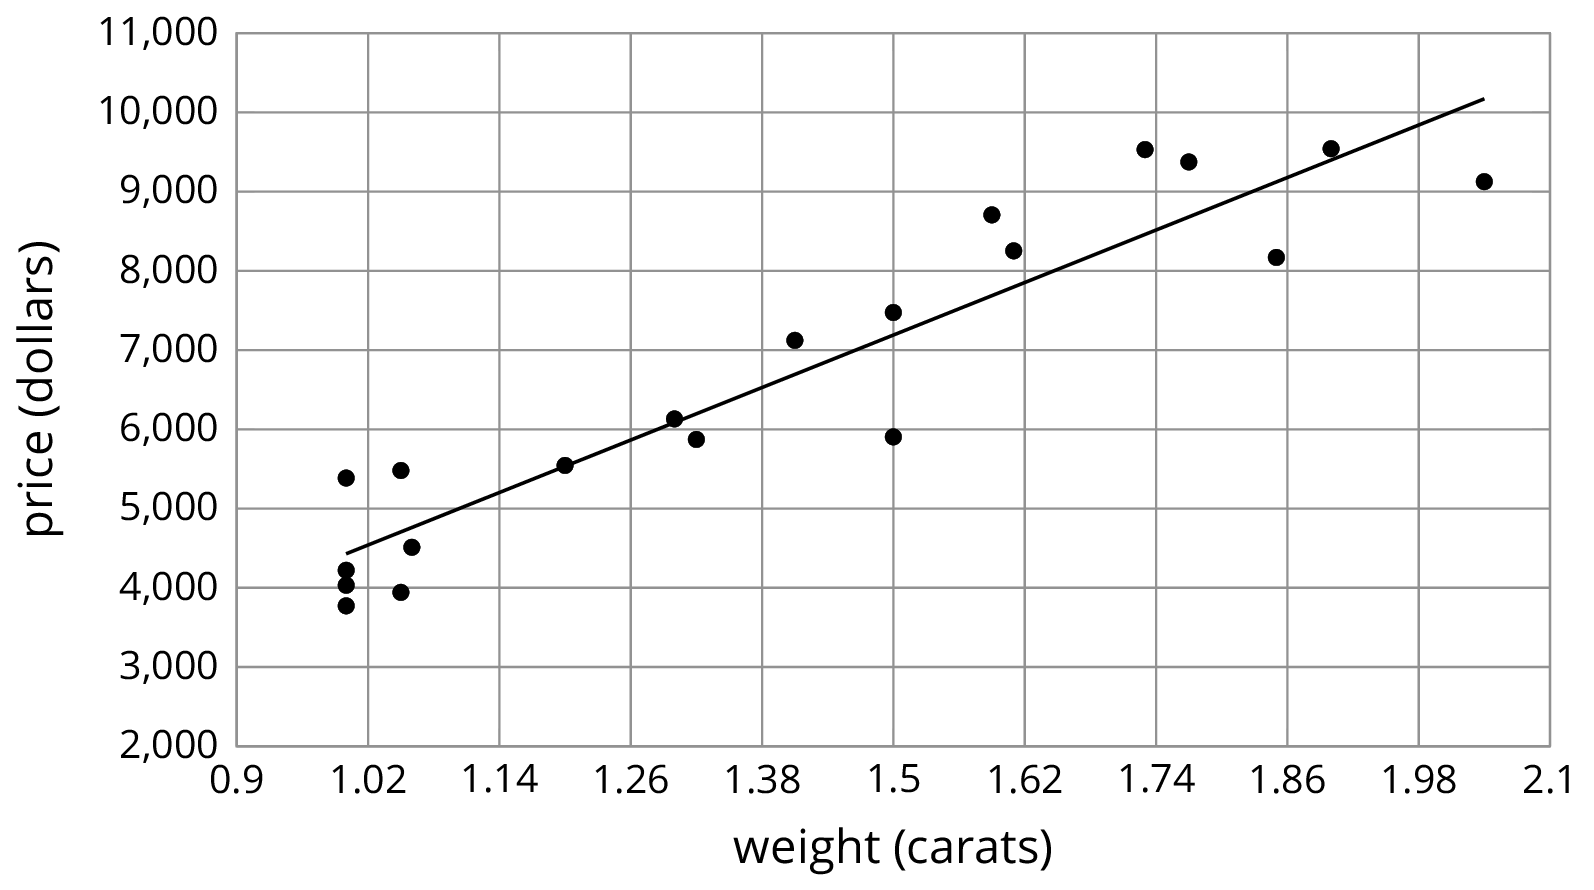
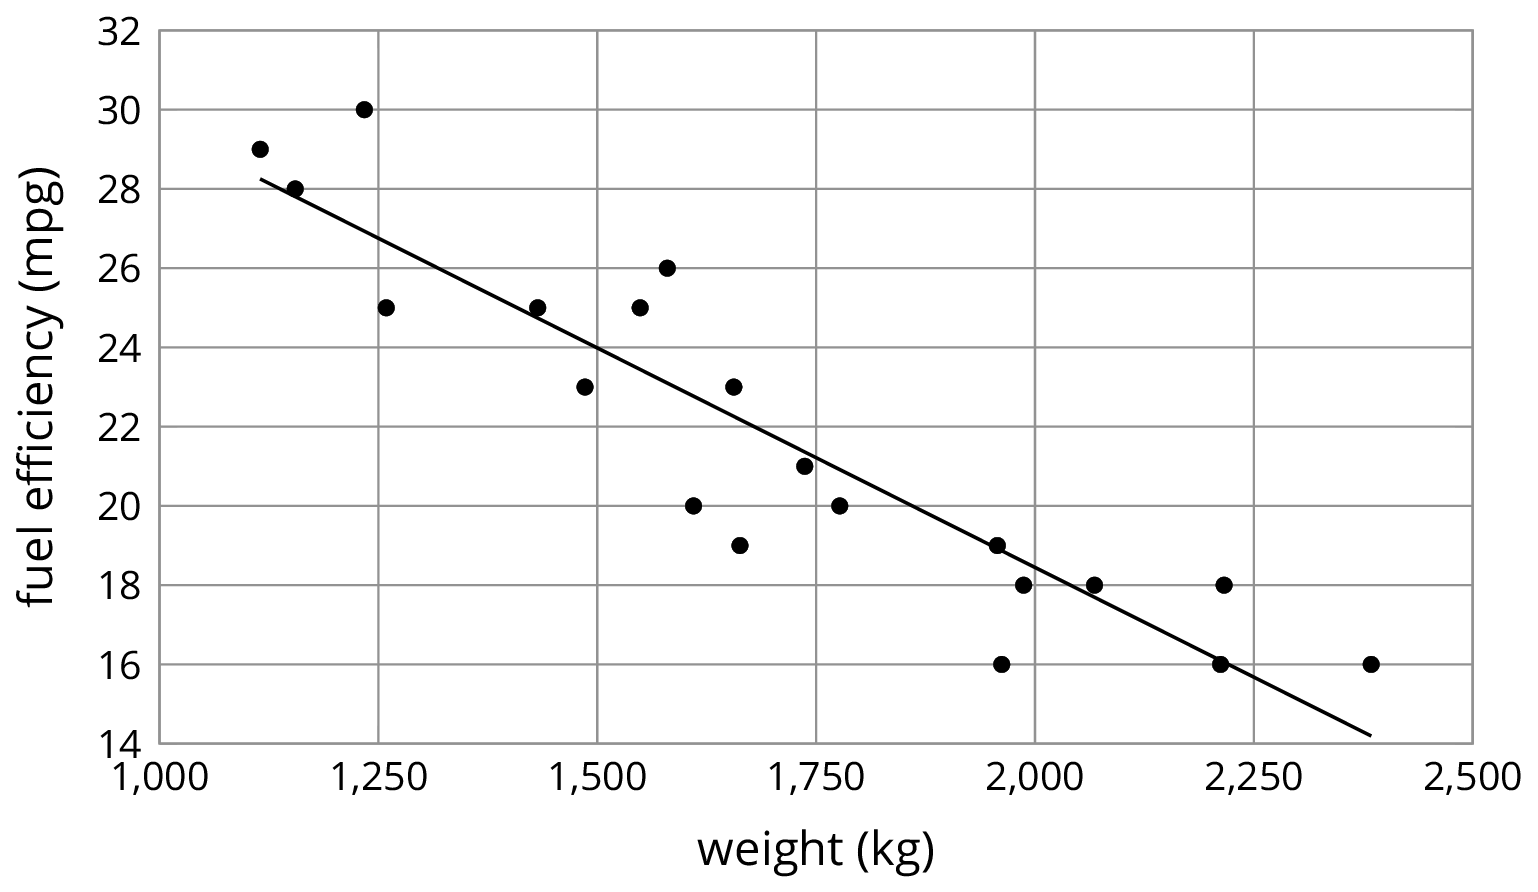
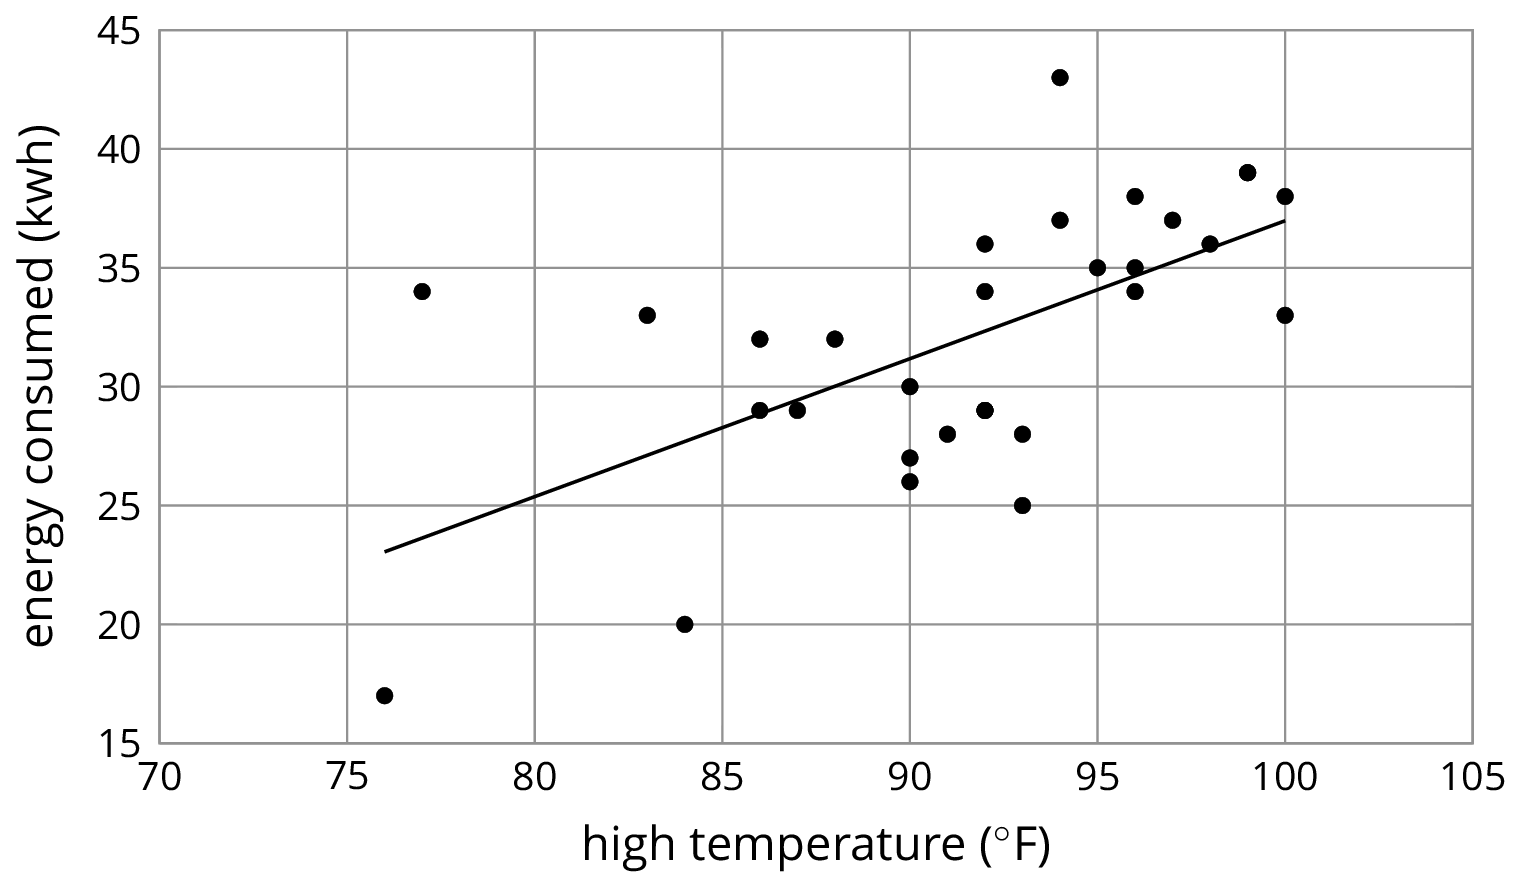
For each of the situations, a linear model for some data is shown.
$y=5,\!520.619x-1,\!091.393$
$y=\text-0.011x+40.604$
$y=0.59x-21.912$
The scatter plot shows the weight and fuel efficiency data used in an earlier lesson along with a linear model represented by the equation $y = \text-0.0114 x +41.3021$.

For each of the scatter plots, decide whether it makes sense to fit a linear model to the data. If it does, would the graph of the model have a positive slope, a negative slope, or a slope of zero?

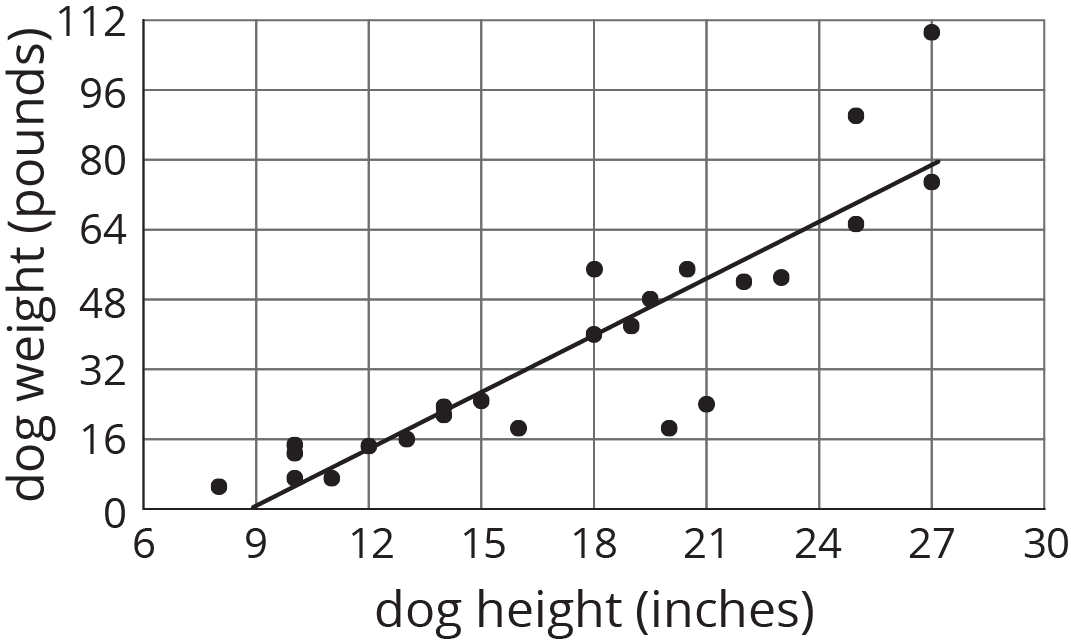
Here is a scatter plot that we have seen before. As noted earlier, we can see from the scatter plot that taller dogs tend to weigh more than shorter dogs. Another way to say it is that weight tends to increase as height increases. When we have a positive association between two variables, an increase in one means there tends to be an increase in the other.
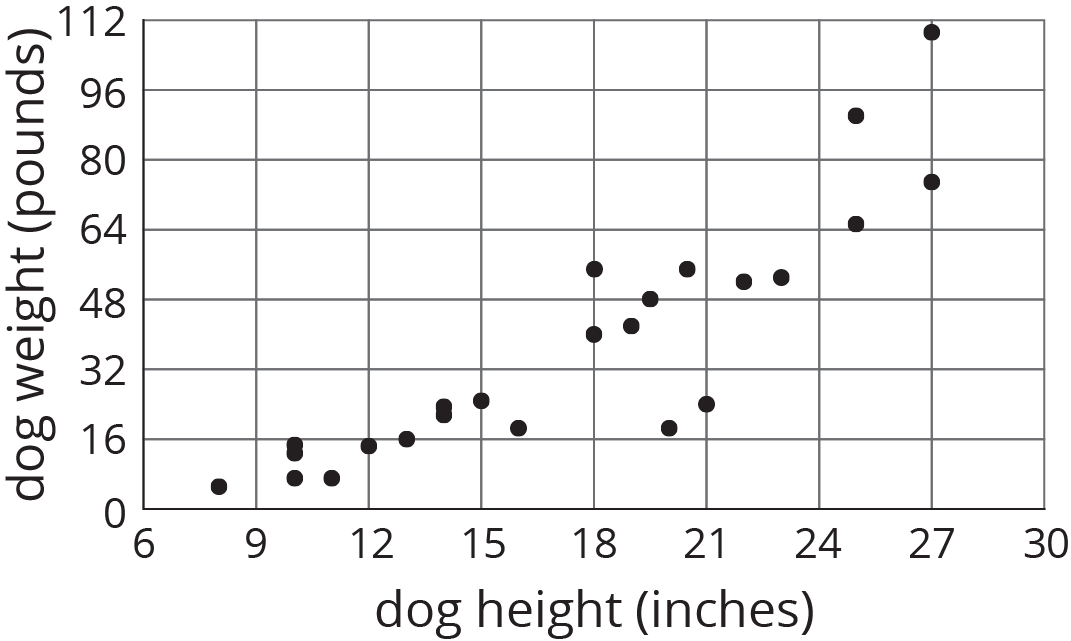
We can quantify this tendency by fitting a line to the data and finding its slope. For example, the equation of the fitted line is $$w = 4.27h -37$$ where $h$ is the height of the dog and $w$ is the predicted weight of the dog.
In our example of the fuel efficiency and weight of a car, the slope of the fitted line shown is -0.01.
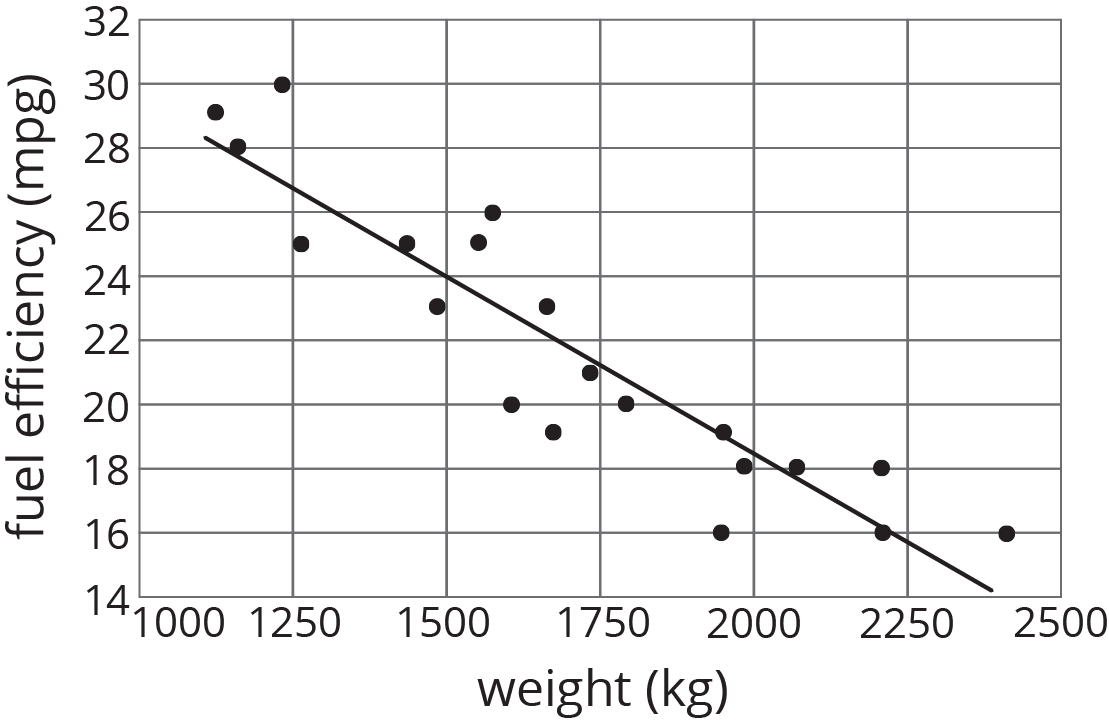
This tells us that for every 1-kilogram increase in the weight of the car, the fuel efficiency is predicted to decrease by 0.01 miles per gallon. When we have a negative association between two variables, an increase in one means there tends to be a decrease in the other.